Download
1 / 41
410 likes | 510 Views
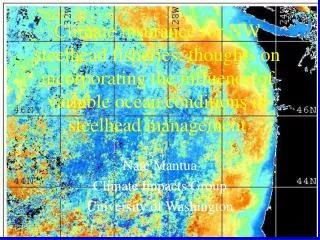
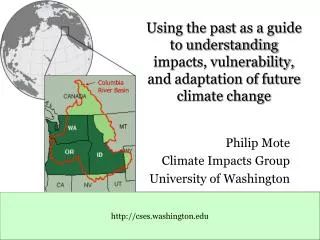
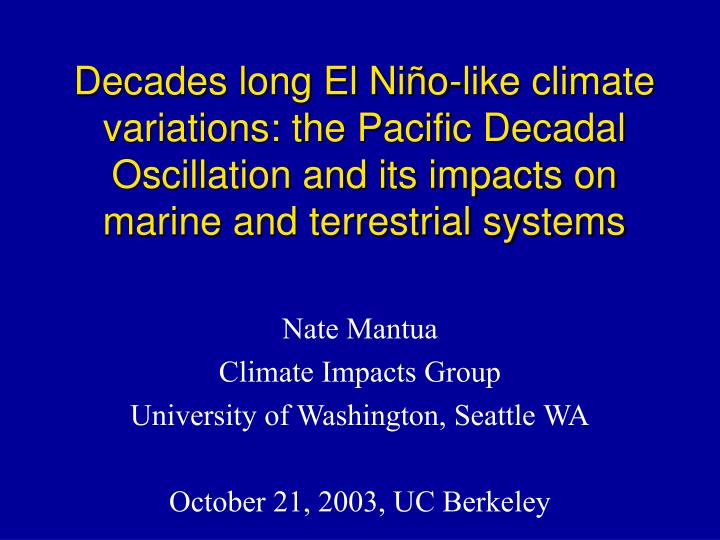
Decades long El Niño-like climate variations: the Pacific Decadal Oscillation and its impacts on marine and terrestrial systems. Nate Mantua Climate Impacts Group University of Washington, Seattle WA October 21, 2003, UC Berkeley. Outline. PDO signatures in Pacific/N. American climate

E N D
Decades long El Niño-like climate variations: the Pacific Decadal Oscillation and its impacts on marine and terrestrial systems Nate Mantua Climate Impacts Group University of Washington, Seattle WA October 21, 2003, UC Berkeley
Outline PDO signatures in Pacific/N. American climate impacts on forests and marine ecosystems paleoclimate evidence mechanisms and predictability
The Pacific Decadal Oscillation • an El Niño-like pattern of climate variability • 20 to 30 year periods of persistence in North American and Pacific Basin climate • PDOfingerprints found in records of temperature, precipitation, snow pack, streamflow, and marine ecosystems 1998? 1947 1925 1977 1900 1925 1950 1975 2000 Mantua et al. 1997: A Pacific Interdecadal Climate Oscillation with Impacts on Salmon Production, Bulletin of the American Meteorological Society, Vol 78, p 1069-1079.
PDO research ... Bothclimate and fisheries research are behind this story • Ebbesmeyer et al’s “1977 Regime Shift” • A step change in 40 environmental parameters in the Pacific (1991) • Nitta and Yamata 1989, Tanimoto et al 1993, Graham 1994, Trenberth and Hurrel 1994, Kawamura 1994, Latif and Barnett 1994, Miller et al 1994, Zhang 1996, Zhang et al 1997, Mantua et al 1997, Minobe 1997 ... and many more have followed
“1976 Step in Pacific Climate: 40 environmental changes …”(Ebbesmeyer et al. 1991, PACLIM proceedings) Large and local scale climate indices, Canadian geese, NW salmon, dungeness crab, Pacific sea birds numbers, Washington Oyster growth … all folded into a 40-member composite variable. (see Kerr, Science Vol 255, 1992)
PDO research at the University of Washington • A product of 3 semi-independent streams of research • Hare and Francis (1992), UW Fisheries Research Institute: North Pacific climate and 20-30 year boom/bust cycles in Alaska salmon • Zhang and Wallace (1994), UW Atmospheric Sciences: Ocean/Atmos variability in Pacific climate, ENSO vs North Pacific Climate Variations • Mantua (1995), UW Climate Impacts Group: Pacific Northwest “climate history”, climate impacts on NW salmon
Oct-March Sea Level Pressure anomalies during warm phases of PDO: an intensified Aleutian Low L H H Contours every .5 mb
500 mb height anomalies during warm phases of PDO: the Pacific North America pattern H L H Contours every 5 meters
October-March PDO Regression fields Surface Air Temperature Precipitation Figures produced by Todd Mitchell, UW/JISAO
Regional Indicators for PDO variability(Mantua et al 1997, BAMS) Gulf of Alaska winter air temperature BC Coastal SST Scripps Pier SST 1925 1947 1977 Kenai River Streamflow BC/Washington Streamflow
winter and spring time temperatures: relatively warm in northwest North America, and cool in the southeast winter and spring time precipitation: wet in the southern US and northern Mexico, and dry in the Pacific Northwest and Great Lakes regions winter and spring time temperatures: relatively cool in northwest North America, and warm in the southeast winter and spring time precipitation: dry in the southern US and northern Mexico, and wet in the Pacific Northwest and Great Lakes regions PDO and North American Climate Warm PDO: 1925-46; 1977-1998(?) Cool PDO: 1900-1924; 1947-1976;
Snowpack, PDO and tree growth Mountain hemlock in the Cascade and Olympic Mountains high elevation OR/WA Mt Hemlock and snowpack Deep snowpack Low snowpack low elevation OR/WA Mt Hemlock and pdo warm/dry warm/dry Cool/wet 1900 1910 1920 1930 1940 1950 1960 1970 1980 1990 2000 From Peterson and Peterson (2001)
Years with fires > 80,000 haFires in national forests, 1916-1997 From Mote et al. (1999)
Alaska Commercial Salmon Catches 1878-2001 Alaska Department of Fish and Game http://www.state.ak.us/adfg
1960’s Bottom trawl surveys in Pavlov Bay, Alaska (source: Botsford et al. 1997, Science, 277: 509-515) 1970’s 1980’s
A history of change from a 50 year record of Gulf of Alaska bottom trawl surveys From: Anderson and Piatt (2000) Mar. Ecol. Prog. Ser 189: 117-123.
Pacific salmon catch data analysis(Hare, Mantua and Francis 1999, Fisheries) • Combine commercial+sport+subsistence catch from 1925-1997 • assume that catch reflects abundance • apply “regional normalization” • focus on critical period by shifting each record in time to reflect typical year of ocean entry (chinook & chum 3 years, sockeye 2 years, coho and pink 1 year)
An Inverse Production Pattern 34% variance Hare, Mantua, and Francis 1999, Fisheries Vol 24: 6-14 PC scores r(pdo) = .73 r(niño34) = .53
Why an inverse production response to PDO/ENSO-related variability? H1: “optimal stability window” and “bottom up” impacts on marine food-webs Gargett 1997, Fisheries Oceanogr. 6:109-117 Phytoplankton production N S Stratification or upwelling
Other coherent patterns in marine ecosystems? Empirical Evidence for N. Pacific Regime Shifts in 1977 and 1989 Hare and Mantua, Progress in Oceanogr. 2000, 47: 103-145
1976-77 1988-89 1976-77: PC1 1988-89: PC2 Hare and Mantua, Progress in Oceanogr. 2000, 47: 103-145
Tree-ring based PDO index reconstructions:(ex: Gedalof and Smith 2001, Geophys. Res. Letts. 28: 1515-1518) Plots courtesy of Torrence and Compo http://paos.colorado.edu/research/wavelets
Geoducks: “gooey duck”, Panopea abrupta geoduck shells may have the tree-rings of the extratropical seas
Thin section of geoduck shell from Protection Island x warm PDO cool PDO 1969 1998 1978 Are Strom, 2003 M.Sc., UW School of Fisheries
Ocean temperature reconstruction based on Protection Island geoduck growth rates Growing season (March-October) temperatures x x x Are Strom, 2003 M.Sc., UW School of Aquatic and Fishery Sciences
Paleo-salmon abundance estimates from lakebed sediment cores(Finney et al. 2000, Science 290: 795-799) 1700 1800 1900 2000
ENSO/PDO combined influences on North American Climate (JFM precipitation) warm PDO/La Niña cool PDO/La Niña Gershunov, Barnett and Cayan 1999 Eos Transactions
Columbia River summer (April-September) streamflow } ~ 20% change Alan Hamlet and Dennis Lettenmaier, UW Civil Engineering
PDO Predictability PDO mechanisms will define itspredictability • best case scenario: • slow ocean adjustment+air/sea coupling (like El Niño) • Worst case scenario: • ocean adjustment to surface fluxes is purely via mixed-layer heat storage -- this would limit predictability to ~ 1 year atmosphere ocean Re-emergence in entraining mixed layers Deser et al. 2003, J. Climate 16:57-72
ENSO-forced variability of the PDO Newman et al. J. Climate Letters (in press) • PDO variability reflects a “reddened” response to atmospheric “white noise” and ENSO forcing (at all time scales) • The basic model: “the PDO is simply due to reemergence + ENSO forcing + random atmospheric forcing” PDOforecastn = *PDOobservedn-1 +*ENSOn + oisen
Simple model performanceNewman, Compo and Alexander (in press) J. Climate Letters Forecast vs. Observed Annual PDO (July-June) • 1 year lead time hindcasts vs Observed correlations • Modeled time series power spectra not as “red” as observed PDO • Prediction for July-June 2004? ~ + .6 to +1 1900 1950 2000 Power Spectra Observed forecast Period
Now-casting • assessing the current status of the PDO is difficult: what should we be tracking???? • El Niño experience tells us that improved understanding will come with improved measurements, diagnostics and modeling
Keeping track of El Niño/Southern Oscillation: the TAO/TRITON array • The backbone of today’s ENSO Observing Network • initiated in 1985, completed in 1994 • 70 moored buoys provide real-time in-situ surface and subsurface conditions (winds, temperatures, currents)
ARGO: the latest addition to a global ocean observing system
Summary • over the past few centuries PDO has been an important pattern of climate variability at periods comparable to a human’s life time • provides insights into the history of water and fishery resources: can we learn from this history? • offers another avenue for improving climate predictions at the seasonal and (potentially) multi-year time scales • fisheries and climate research communities putting lots of effort into learning more about PDO and its impacts
upwelling food webs in our coastal ocean: the California Current http://www.noaa.gov/ Cool water, weak stratification high nutrients, a productive “subarctic” food-chain with abundant forage fish and few warm water predators Warm stratified ocean, few nutrients, low productivity “subtropical” food web, a lack of forage fish and abundant predators Abundant Krill! Krill are in short supply