Download
1 / 32
320 likes | 415 Views
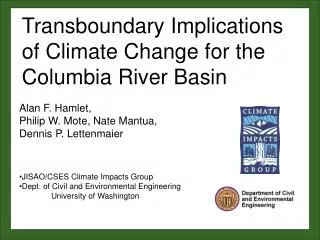
Columbia River Basin. Using the past as a guide to understanding impacts, vulnerability, and adaptation of future climate change. Philip Mote Climate Impacts Group University of Washington. http://cses.washington.edu. Outline .

E N D
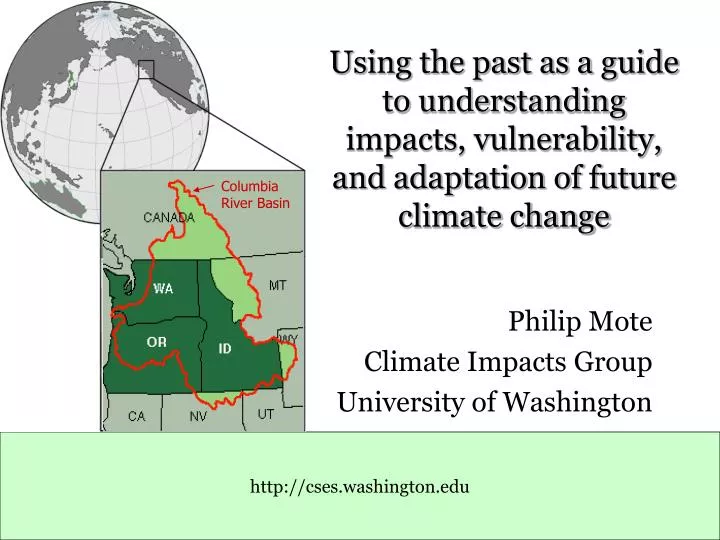
Columbia River Basin Using the past as a guide to understanding impacts, vulnerability, and adaptation of future climate change Philip Mote Climate Impacts Group University of Washington http://cses.washington.edu
Outline • Introduction: Climate Impacts Group (CIG) and Regional Integrated Sciences and Assessment • Climate variability and short-term forecasts • Sensitivity calculations as a guide for climate change • Institutional response to stress
NOAA’s RISA program 1995-98 Northwest, California, Southwest, Florida, Western Water Assessment 2002-2003 New England, Hawaii/Pacific Islands, Carolinas
The Climate Impacts Group Elements of the PNW we study: • Water resources • Salmon • Forests • Coasts • Human health • [Agriculture] http://cses.washington.edu
A history of the PDO A history of ENSO warm warm cool 1900 1910 1920 1930 1940 1950 1960 1970 1980 1990 2000 1900 1910 1920 1930 1940 1950 1960 1970 1980 1990 2000
Columbia River Apr-Sep streamflow 5 4 3 105 cubic feet per second 2 1 0 1900 1920 1940 1960 1980 2000
Forecast at The Dalles using Resampling Methods Blue = ensemble mean Red = long-term mean
Alaska and PNW salmon production are out of phase (Hare et al 1999, Fisheries)
Plankton surveys Run-size forecast (using SST forecast) Run-size forecast (using obs’d conditions) Forecasting Salmon Returns Oregon coho salmon survival Coastal Ocean Conditions Sea surface temperatures Sea level Nearshore winds Fall Winter Spring Summer Jack returns Harvest & allocation decisions(February) Fishery
Temperature-CO2 regression T(t)=a ln(CO2)+(t)
13 12 Climate model averages 11 10 °C 9 8 7
Simulation of future snowpack with VIC hydrologic model Trend in total April 1 snowpack, 1950-97: -11% Courtesy Andrew W. Wood, University of Washington
Correlations between Nov-Mar climate and Apr 1 SWE X-direction: precip Y-direction: temp Coldest locations insensitive to temperature Cascades very sensitive
As the West warms, winter flows rise and summer flows drop Figure by Iris Stewart, Scripps Inst. of Oceanog. (UC San Diego)
Trends in timing of spring snowmelt (1948-2000) +20d later –20d earlier Courtesy of Mike Dettinger, Iris Stewart, Dan Cayan
Snow-climate regression SWE(t)=a1T(t)+a2P(t)+(t) April 1 SWE, Nov-Mar T and P
April 1 SWE trends, 1950-2002 aT<T> aP<P>
Fire-climate regression Log(Area)(t)=a1T(t)+a2P(t)+(t) June-July-August T & P
Managing drought: Summer 2001 case studies • Summer 2001: Klamath showdown over irrigation • Idaho: water markets, water banking efficiently spread the pain • What can we learn? Right way and wrong way to manage competing demands
Conclusions • Seasonal forecasts a useful bridge to climate change • Examining the past is key to understanding the future: • Hydrological sensitivity to warming • Biological response to climate • Social response to climate stresses
Hydrologic Characteristics of the Columbia Basin The Dalles Elevation (m)