Download
1 / 12
120 likes | 216 Views
Identifying the Role of Solar-Wind Number Density in Ring Current Evolution. Paul O’Brien and Robert McPherron UCLA/IGPP. Background CIR Topology Model Plasma Entry Model New Analysis 1994-1997 1964-1997 Solar Min Solar Max Conclusions.

E N D
Identifying the Role of Solar-Wind Number Density in Ring Current Evolution Paul O’Brien and Robert McPherron UCLA/IGPP
Background CIR Topology Model Plasma Entry Model New Analysis 1994-1997 1964-1997 Solar Min Solar Max Conclusions Does enhanced solar-wind number density drive the ring current? The observed relationship between solar-wind number density and Dst is best explained by the solar-wind topology of corotating interaction regions Outline
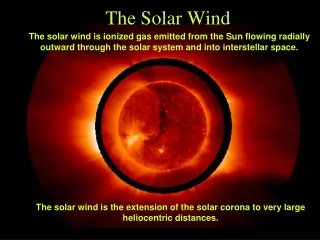
Rosenberg [JGR April 1982] proposed that the typical structure of corotating interaction regions (CIRs) gave rise to a dense plasma front 6 hours (time-of-flight) prior to a strong IMF-Bz (North or South) A strong southward Bz would then cause a magnetic storm in Dst 25 density enhancements from 1978-1979 were used in a super-posed epoch analysis Pizzo [JGR March 1994] reproduced this behavior in MHD simulations North-South velocity and IMF were seen behind the CIR density front CIRs are dominant only during Solar Minimum Dense Plasma Front VFast IMF VSlow Bz VSlow z x y VFast Bz z 6 hours x y 6 hours CIR Topology Model
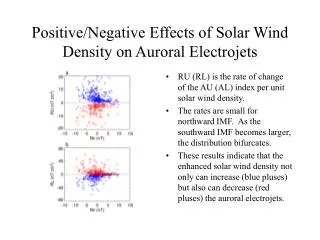
Borovsky et al.[JGR August 1998]suggested that solar wind plasma enters the ring current through the plasma sheet Enhanced solar wind density leads to stronger ring current after 4+ hours This process should occur at all phases of the Solar Cycle Solar Wind Geosynchronous 4 hr Lag Turbulent or Viscous Exchange 2 hr Lag Plasma Entry Model
Smith et al.[GRL July 1, 1999]found a strong density precursor 5-6 hours prior to the minimum Dst in a storm Electric Field Driver Density Precursor Initial Observations • The study covered 55 moderate storms 1994-1997(solar minimum conditions) • The density “driver” was independent of the electric field (VBs)
Using the OMNI database from 1964-1997, it was not possible to detect the Smith et al. signal Other methods also were not able to detect a signal More Observations • This analysis covered 440 moderate storms (solar minimum and solar maximum conditions) • There was no signal for a density “driver”
Using only storms within 2 years of Solar Maximum it was not possible to detect a density precursor CIRs are not common at Solar Maximum Solar Max Observations • The analysis covered 155 moderate storms (solar maximum conditions only) • There was no signal for a density “driver”
Using only storms within 2 years of Solar Minimum an ambiguous density signal was detected This would be consistent with a density enhancement at several hours lag associated with CIR topology Solar Min Observations • The analysis covered 176 moderate storms (solar minimum conditions only) • There was a possible response for density after 5 hours
The only data subsets that showed a density precursor were those that excluded Solar Maximum data Therefore, the density precursor is a Solar Minimum phenomenon, probably associated with CIR topology Data Subsets 180 Entire Database 160 140 Solar Maximum 120 100 Rosenberg 80 Smith et al. 60 Solar Minimum 40 20 0 1960 1965 1970 1975 1980 1985 1990 1995 2000 Year Smoothed Sunspot Number Solar Cycle Dependence
Conclusions • The observed relationship between solar-wind number density and Dst is best explained by the solar-wind topology of corotating interaction regions • Solar wind number density is probably a precursor but not a driver of the ring current at a lag of 5+ hours • The correlation is only seen at Solar Minimum • The strength of the ring current does not appear to be causally related to solar wind density enhancements • Other methods (not presented) support this conclusion: • Statistical Dst phase-space analysis • Analytical Dst dynamics optimization • Neural Network Dst dynamics simulation
PVO Disturbances Over Solar Cycle 35 180 160 30 140 25 120 Solar Minimum 20 Yearly Normalized Monthly Occurrence Rate 100 80 15 60 10 40 SunSpots CMEs CIRs 5 20 0 0 79 80 81 82 83 84 85 86 87 88 Year Solar Cycle Phenomena • Lindsay et al. [JGR January 1994]analyzed CIRs and CMEs at 0.72 AU • CIRs occur most frequently at Solar Minimum • CMEs occur most frequently at Solar Maximum
Bi-Linear Correlation Method • A bi-linear model is built by linearly regressing the minimum Dst during a storm versus the solar wind electric field VBs and number density nsw: • min(Dst) Yl,m = x0 + x1*VBs(t-lDt) + x2*nsw(t-mDt) • The bi-linear correlation coefficient is: • rl,m = corr(min(Dst),Yl,m) • A correlation coefficient of 0.0 indicates no correlation, 1.0 indicates a perfect model