Download
1 / 95
950 likes | 1.24k Views
United Arab Emirates Overview 2008. Alain PRADELLE, Emilie ROUYER, Elsa BEAUDIER (with the help of G. KARAM, C. CROIZE) 25/01/2008. Table of content. Macro Economics and Investments Trends Market (in Volume) ALU Market Share (in Volume) & Main Competitors

E N D
United Arab EmiratesOverview 2008 Alain PRADELLE, Emilie ROUYER, Elsa BEAUDIER (with the help of G. KARAM, C. CROIZE) 25/01/2008
Table of content • Macro Economics and Investments Trends • Market (in Volume) • ALU Market Share (in Volume) & Main Competitors • Voice Communication Distribution • Cisco • Siemens • Avaya • Nortel • Data Market: Ethernet LAN Switches • Data Market: Wireless LAN Market • Competition Positioning and Distribution • Competitors Marketing Mix Strategy • Alcatel SWOT Analysis • Events: M&A’s • Back Up • Cisco • Siemens • Avaya • Nortel
1 Macro Economics and Investments Trends
Macro Economics and Investments Trends in UAE -Real GDP growth was very high in 2003 (11.9%). -From 2004, it has decreased slowly. -But growth is always sustained (10% in 2004 and 7% in 2008). Source: IMF-Ap2007
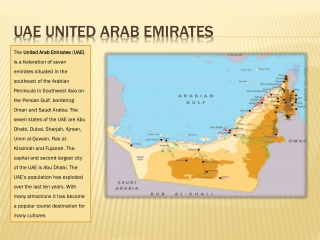
Demographic Facts • The 7 Emirates are: Abu Dhabi, Dubai, Sharjah, Ajman, Umm Al Quwain, Ras Al Khaimah, and Fujairah. • Government: Federation of the seven Emirates, each with its own ruler. • Capital: Abu Dhabi. • Population: 4,104,695 (Ministry of Economy 2006). • Language: Arabic is the official language, although English is widely used and is the language of commerce. • Religion: Muslims 96%; Christian, Hindu, and others 4%. • Economy: The country is a major oil exporter and the UAE is one of the richest countries in the world with a GDP per capita income of $ $ 29.951. (Source: IMF, at current prices) • Currency: The UAE Dirham (Dh), Exchange Rate: 3.65 Dh per US $1. • Time Difference: CUT + 4 hours. Source: http://datadubai.com
Enterprise segmentation UAE 4.500 50 + Employees < 50 Employees 45.000 Businesses Oil is still the predominant driver of the economy, but the start of liberalization and privatization of key sectors such a banking, telecommunications and public utilities and the undergoing effort to generate new sources of income are creating an environment of growth for a wide range of businesses. Source: Madar Research 2004
2 Market in Volume
PBX / IP-PBX > 10 Market Trend Thresholds in people employed (not lines) 11% 12% CAGR 2004-2008: + 12% Source: Internal Alcatel-Lucent
PBX / IP-PBX Market Trends Thresholds in people employed (not lines) CAGR 2004-2008: -10-100: + 13% -100-250: + 11% -250+: + 10% 10% 14% 11% 12% 12% 14% Source: Internal Alcatel-Lucent
PBX / IP-PBX Market in End-User Value (M€ and > 10 lines) CAGR 2006-2009: + 1.6% Increase in End-User value is smaller than increase in volume . This is due to the decrease in price per extension. Please note that these figures are rough estimates and that there are no comparable quantifications by related consultants available.
3 Alcatel Market Share (in Volume) & Main Competitors
Competition Waiting for Madar Research Report to have a more realistic figure about ALU MS in UAE The below 200 lines market is dominated by: • Siemens (Etisalat) • NEC (Etisalat) • Panasonic • Nortel The above 200 lines market is dominated by: • Alcatel-Lucent • Siemens (Etisalat) • NEC (Etisalat) • Nortel • Avaya Source: Madar-Oct2004
Detailed Applications Market Contact Centre Seats per Country - End 2003 Strong orientation for businesses and services has made the UAE Contact Centers installed base grow to 150 units representing 3 kagents in 2003, outranking the regions largest economy Saudi Arabia. Source: Madar-Oct2004
4 Voice Communication Distribution
Business Partners in UAE (1/2) Cisco BPs Siemens BPs Note: A presentation of each BP is available in Back-Up Source: Alcatel-Lucent
Business Partners in UAE (2/2) Avaya BPs Nortel BPs Note: A presentation of each BP is available in Back-Up Source: Alcatel-Lucent
Cisco BPs in UAE Source: Alcatel-Lucent
Siemens BPs in UAE Source: Alcatel-Lucent
Avaya BPs in UAE Source: Alcatel-Lucent
Nortel BPs in UAE Source: Alcatel-Lucent
Small (6 - 100) Voice Communication Distribution: To Be Updated By Local Unit PBX Manufacturers Direct SI & VAR’s Distributors Operators Vendors: Channels: Vendors: Channels: Vendors: Channels: Vendors: To Be changed if used Indirect Dealers Based on Volume Shipments End-Users Source: Internal Alcatel-Lucent
Large (> 100) Voice Communication Distribution To Be Updated By Local Unit PBX Manufacturers Direct SI & VAR’s Distributors Operators Vendors: Channels: Vendors: Channels: Vendors: Channels: Vendors: To Be changed if used Indirect Dealers Based on Volume Shipments End-Users Source: Internal Alcatel-Lucent
Tentative Top 5 distributors list(adjustments from field welcomed) Example given France, to be replaced by corresponding information for UAE if info is available in the local unit. To Be changed if used
5 Data Market: Ethernet LAN Switches
Worldwide: Split of Ethernet Switch Market in 2006 In Value (in manufacturing revenue) In Volume Total Market: 16 030 $M Total Market: 177 438 KPorts L2-L3 excluding unmanaged fixed represents a high share of ethernet switch market in volume and value Source: Dell’Oro Group
EMEA: LAN Switches market by bandwidth in Volume (KPorts) Total CAGR: + 12% 10 GPBS is included but still very small: 0.1% of total in 2005, 0.2% of total in 2006 51 085 45 689 CAGR 2005-2006: • 10 GPBS: + 101% • 1000 MPBS: + 36% • 100 MPBS: 3% *excluding fixed unmanaged (Worldwide percentage applied on EMEA) Source: Gartner-March2007
EMEA: LAN Switches market by bandwidth in Value(In Manufacturer Revenue, €M) Total CAGR: + 18.7% CAGR 2005-2006: • 10 GPBS: + 58.0% • 1000 MPBS: + 26.1% • 100 MPBS: -0.4% 3 441 6.6% 2 925 4.9% 2005: 1 $=0.8035 € 2006: 1$=0.7964 € *excluding fixed unmanaged (Worldwide percentage applied on EMEA) Source: Gartner-March2007
EMEA: LAN Switches Market Share Evolution in Volume L2+L3 Modular + Fixed, managed, unmanaged 38% 36% 16% 14% 13% 12% 11% 8% 6% 5% 4% 3% 3% 1% 1% 1% Nortel Networks gained 11 points and 3Com lost 13 points between 2005-2006 Source: Gartner-March2007
EMEA: LAN Switches Market Share Evolution in Value L2+L3 Modular + Fixed, managed, unmanaged 72% 71% 6% 4% 4% 5% 5% 4% 5% 2% 2% 3% 2% 1% 1% 1% Source: Gartner-March2007
EMEA: Power Over Ethernet Market Evolution With 11,760 Kport shipments in 2006, the EMEA POE market represents nearly 41% of the WW POE market. The average POE average premium price tends to decrease YoY. In 2006, the average price was about 20.4k€ compared to 26.8k€ in 2005. Evolution of POE Market Source: Gartner 2007 Compared to 2005, the POE penetration rate in EMEA raised 4.6pts up to 14.4% in 2006 30 | Presentation Title | Month 2006
EMEA: Power Over Ethernet Vendors in 2006 NOTE: PoE premium revenue only includes the revenue derived from the premium charged per PoE port inside the switch. PoE in Value (€M) 69% 74.4% 9.9% 6.8% 7.1% 1.9% 5.3% 7.8% 5.6% 6.5% 2.1% 3.6% EMEA POE Market in Value was about 239.9 M€ in 2006 EMEA POE Market in Volume was about 11 760.3 Kports in 2006 Source: Gartner-March2007
6 Data Market: Wireless LAN Market
Worldwide: Wireless LAN Market in Volume Per Region CAGR (2004-2006) Total: +24 % Rest of World: +14 % Asia Pacific: +3 % EMEA: +26 % North America: +33 % Wireless LAN Market in Volume (Kunits) Source: Dell’Oro 2007 33 | Presentation Title | Month 2006
Worldwide - Wireless LAN Market:Enterprise Total Evolution 2353 1757 3043 In Volume Units (000’s) In volume and value, the share of Acess Points Independent has decreased, in benefit of Acess Points Depedent. 710 988 1265 In Value€M(in Manufacturer Revenue) 2005: 1 $=0.8035 € 2006: 1$=0.7964 € Source: Dell’Oro Group
EMEA – Wireless LAN Market: Enterprise Total Competition in Volume Gaining Shares: -Motorola: + 4 pts -Aruba: + 2 pts Stable: Proxim, HP ProCurve, Alcatel-Lucent, Enterasys Losing Shares: -3Com: - 5 pts -Cisco: - 4 pts 2% 1% 1% 1% 1% 1% 3% Source: Dell’Oro Group
7 Competition Positioning and Distribution
Main Distributors of main competitors To be validated and updated by local unit • Etisalat (Siemens, NEC and Phillips) • Al Futtaim Technologies (Alcatel) • Al Rostamani Communications (Panasonic, Avaya) • Aten (Panasonic) • Al Rand Trading (Panasonic, Rand) • Emirates Telecommunications Company - EITS (Siemens and NEC) • Mindscape (Nortel) Source: Madar-Oct2004
Alcatel distribution in UAE To Be Updated By Local Unit ? Premium ? Data Mid/Large Enterprise Sector focus (PCX Office & To Be changed if used PCX Enterprise) Specialization Sell via 2nd-tier Resellers ? Master Distributor ? Expert Small Enterprise Sector focus (PCX Office only) ? Certified Stand-alone Specialization available for Network Infrastructure Solutions Source: Internal Alcatel-Lucent
8 Competitors Marketing Mix Strategy
Competitor (1 to 5) Marketing Mix Strategy To be validated and updated by local unit Source: Internal Alcatel-Lucent
9 Alcatel-Lucent SWOT Analysis
Internal Strengths SWOT Analysis for UAE • Internal Weaknesses To be validated and updated by local unit • External Opportunities • External Threats Source: Internal Alcatel-Lucent
Gartner EMEA Magic Quadrant Figure 1. Magic Quadrant for Corporate Telephony in Europe, the Middle East and Africa, 2007 Source: Gartner-Aug2007
10 Events: M&A’s
Voice Telephony and Data Market: Main Events (M&A Summary) Total acquisitions have almost represented € 18,294m during the last years • Cisco is the leader in M&A, with a total of € 3,911m, representing 21% of the total acquisitions amount • Avaya’s total acquisitions amount is approximately € 613m, 3.4% of the total M&A market • Nortel has spent € 73m, 0.4% of the total M&A market • Alcatel-Lucent’s acquisitions amount is nearly € 36m, 0.2% of the total M&A market
Voice M&A 46 | Presentation Title | Month 2006
Video M&A Distribution M&A Other M&A