Download
1 / 5
50 likes | 145 Views
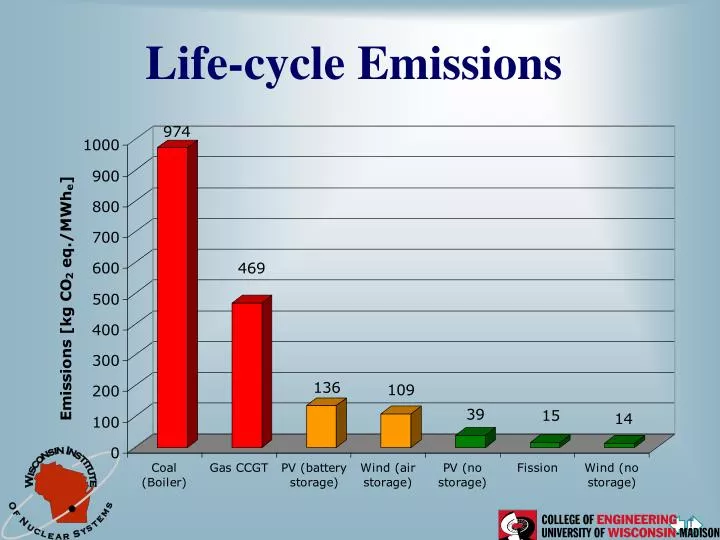
Life-cycle Emissions. Environmental Impact: US Sources of Emission-Free Generation ( 2009). Geothermal 1.3%. Photovoltaic <.1%. Hydro 29.1%. Wind .34 %. Nuclear 69.2 %. Source: EIA. Record U.S.Nuclear Electricity Production. (Billions of Kilowatt-hours). Source: EIA.

E N D
Environmental Impact:US Sources of Emission-Free Generation (2009) Geothermal 1.3% Photovoltaic <.1% Hydro 29.1% Wind .34 % Nuclear 69.2% Nuclear Power: Prospects for the 21st Century Source: EIA
Record U.S.Nuclear Electricity Production (Billions of Kilowatt-hours) Source: EIA Nuclear Power: Prospects for the 21st Century
Capacity Factors Improvement 95% 86.8% in 1999 89.6% in 2000 90.7% in 2001 91.7% in 2002 85% 75% 65% 55% ‘80 ‘85 ‘90 ‘95 Source: NEI ‘00 Nuclear Power: Prospects for the 21st Century
Lowest Electricity Production Costs 3.5 2.09 ¢/kWh in 1998 1.90 ¢/kWh in 1999 1.81 ¢/kWh in 2000 1.68 ¢/kWh in 2001 3.0 2.5 (cents/kilowatt-hour) 2.0 1.5 ‘80 ‘85 ‘90 ‘95 ‘00 Source: NEI Nuclear Power: Prospects for the 21st Century