Download
1 / 12
210 likes | 700 Views
Echelle Spectroscopy. Dr Ray Stathakis, AAO. What is it?. Echelle spectroscopy is used to observe single objects at high spectral detail. The spectrum is mapped as a 2-dimensional array onto the detector, providing large wavelength coverage. How is it done ? 1) The Echelle grating.

E N D
Echelle Spectroscopy Dr Ray Stathakis, AAO
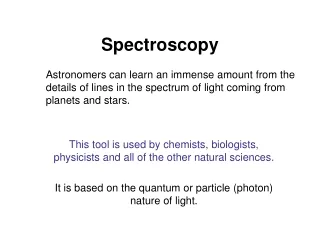
What is it? • Echelle spectroscopy is used to observe single objects at high spectral detail. • The spectrum is mapped as a 2-dimensional array onto the detector, providing large wavelength coverage.
How is it done ? 1) The Echelle grating. • Gratings produce a double series of repeated spectra through diffraction. • The spectra closest to the centre are the 1st orders. Conventional spectrographs usually operate in 1st or 2nd order. • Echelle gratings are specially designed to operate at very high orders (70 - 150). • Each order has a blaze efficiency function. • The rulings are coarse. • The light reflects off the short face. • The Echelle grating operates at large angles.
How is it done ? 2) The Cross-Disperser • Successive orders overlap with constant Ml. • M = order number, l = wavelength • e.g. red light at 8000A in order 71 falls on top of blue light at 4000A in order 142. • the peak of the blaze function goes bluer for larger orders. • A prism or grating is used to disperse light in the perpendicular direction to the Echelle grating to separate the orders. • The result at the detector is a stack of spectra from successive orders, which goes from blue at the bottom left corner to red at the top right corner. • The FSR is the range of wavelengths most efficiently observed at each order.
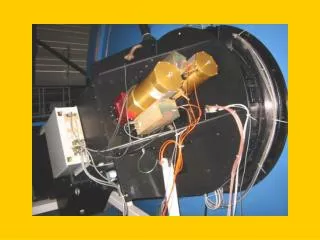
How is it done ? 3) Spectrograph design • The main Echelle spectrograph at the AAT is UCLES. • It is floor-mounted at the Coude focus. • Two configurations: • 31 g/mm gives wide wavelength range, full FSR coverage • 79 g/mm gives 2.5 x sky coverage
Designing your Experiment1) Pros and cons of Echelles R=300 • Advantages: • Efficient at high spectral resolution R where R=l/Dl = 30,000 -1,000,000or resolving 10 - 0.3 km/sec at 6000A • Accurate removal of sky features • Large wavelength coverage. • Disadvantages • Limited magnitude range • Complex instrumental profile • Small sky coverage • Slow turnover time R=2500 R=40,000 R=1,000,000
Designing your Experiment2) Getting it Right • Check whether you need larger sky coverage. • Check the location of important regions of the spectrum • Choose the optimum detector. • Check integration times using the S/N calculator.
Observing Technique • The detector is rotated and focused, and the grating is shifted to locate the wavelength region. • The beam is continuously rotated to align the slit with the direction of atmospheric dispersion. • A ThAr arc lamp exposure is taken to calibrate wavelengths. • An optional iodine cell provides even more accurate wavelengths.
Data Processing • Special packages exist to handle the format, e.g. DOECHELLE in IRAF & ECHEMOP in Starlink • Data reduction steps are: • standard detector correction • location and identification of orders • straightening of orders & forming “echellogram” • wavelength calibration • location of target and sky in each order and correction of sky • combination of orders into continuous spectra
Examples of Echelle Science • Searching for planets by finding stars which wobble. • Observing atmospheres of stars which pulsate. • Observing halo stars to determine the chemical history of our galaxy, and even the universe.
Other Echelle Techniques • UHRF - provides single order observations at up to R = 940,000. • UHRF is ideal for studying cool clouds in the ISM. • Other projects include atmospheric lines from Mercury and isotopes in stars. • The Semel polarimeter is used with UCLES. The main project is Zeeman Doppler Mapping of the magnetic structure of stars. • The Manchester Echelle provides single order observations over a large area, and is ideal for ISM emission line studies.
Useful sites and references Useful technical information can be obtained at the AAO web site: • http://www.aao.gov.au/astro/instrum.html under UCLES and UHRF. See the on-line manual, the S/N calculator and on-line ThAr arc atlas. Further reading includes: • “Astronomical Optics” by Daniel Schoeder, 1987, Academic Press Inc. (General) • Walker, D. D. & Diego, F. 1985, MNRAS, 217, 355-365 (UCLES) • Barlow, M. J. et al., 1995, MNRAS, 272, 333-345 (UHRF) • Diego, F., et al. 1995, MNRAS, 272, 323-332 (UHRF) • Diego, F. & Walker, D. D. 1985, MNRAS, 217, 347 (UCLES & UHRF)