Download
1 / 29
290 likes | 296 Views
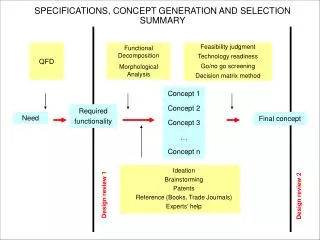
Database Clustering and Summary Generation. Tae-Wan Ryu and Christoph F. Eick. Similarity Measures For Multi-valued Attributes for Database Clustering. Tae-wan Ryu and Christoph F. Eick Department of Computer Science University of Houston Talk Organization Database Clustering

E N D
Database Clustering and Summary Generation Tae-Wan Ryu and Christoph F. Eick
Similarity Measures For Multi-valued Attributes for Database Clustering Tae-wan Ryu and Christoph F. Eick Department of Computer Science University of Houston Talk Organization • Database Clustering • Problems of Database Clustering • Extended Data Sets • Similarity Measures for Sets and Bags • An Architecture for Database Clustering • Summary and Conclusion
General KDD Steps Data sources Selected/Preprocessed data Transformed data Extracted information Knowledge Select/preprocess Transform Data mine Interpret/Evaluate/Assimilate Data preparation
Research Goal To develop methodologies, techniques, and tools to create summaries from databases using cluster analysis and genetic programming Our approach • Partition the database into groups of similar objects using cluster analysis • Find commonalities that objects belonging to each group share using genetic programming
Database Summary Generation Steps and Example < Steps > < Example > Database Restaurant database Database Clustering Clusters Groups of similar objects White color Retired Young Summary Generation Midnight Dinner Lunch Summaries describing the commonalities within each group
Preprocessing forDatabase Clustering Preparing input data sets for clustering Appropriate data selection and preparation from a database is important task Key Problems • How to support a user’s viewpoint including attribute selection • Data model discrepancy between storage format and the input format that clustering algorithms assume • How to cope with structural information, especially 1:n and n:m relationships
Input Format for Data Mining Algorithms Data Format for Input Data Sets • Single flat file format (basically, the data set has to be stored as a single(!) relation) • Complex and structured formats Problem: Almost all existing data mining and clustering approaches assume that input data set is in single flat file format.
An Example Database to Illustrate the Problems with Relationship Information in Database Clustering PersonPurchase Joined result (a)(b) ptype (payment type): 1 for cash, 2 for credit, and 3 for check, the cardinality ratio is 1:n (a) an example of Personal relational database, (b) a joined table from Person and Purchase relations ssnnameagesex 111111111 Johny 43 M 222222222 Andy 21 F 333333333 Post 67 M 444444444 Jenny 35 F ssn location ptype amount date 111111111 Warehouse 1 400 02-10-96 111111111 Grocery 2 70 05-14-96 111111111 Mall 3 200 12-24-96 222222222 Mall 2 300 12-23-96 222222222 Grocery 3 100 06-22-96 333333333 Mall 1 30 11-05-96 name age sex ptypeamountlocation Johny 43 M 1 400 Mall Johny 43 M 2 70 Grocery Johny 43 M 3 200 Warehouse Andy 42 F 2 300 Mall Andy 42 F 3 100 Grocery Post 67 M 1 30 Mall Jenny 35 F null null null
Existing Approaches Applying aggregate functions or generalization operators to convert a multi-valued attribute into a single valued attribute. Problems • User has to make a critical decision (e.g., which aggregate function to use?) • Valuable related information may be lost.
Extended Data Sets name age sex ptypeamountlocation Johny 43 M 1 400 Mall Johny 43 M 2 70 Grocery Johny 43 M 3 200 Warehouse Andy 42 F 2 100 Mall Andy 42 F 3 100 Grocery Post 67 M 1 30 Mall Jenny 35 F null null null name age sex p.ptype p.amount p.location Johny 43 M {1,2,3} {400,70,200} {Mall, Grocery, Warehouse} Andy 21 F {2,3} {100,100} {Mall, Grocery} Post 67 M 1 30 Mall Jenny 35 F null null null A converted table with a bag of values How to measure similarity between bags of values? • Group similarity measures are needed.
Approaches for Database Clustering Structured database Clustering algorithms Manual transformation Flat file <Current approach> Structured database Extended data set Automated preprocessing Generalized Clustering algorithms <Proposed approach>
Related Work • LABYRINTH (Thompson et al.) • Ketterlin’s extended COBWEB • KATE (Manago et al.) • SUBDUE (Holder et al.) • INLEN (Ribeiro et al.) • KBG (Bisson et al.), KLUSTER (Kietz et al.)
Research Objectives for Database Clustering • To alleviate the representational gab between databases on the one hand and input formats of clustering algorithms on the other hand • To design and implement semi-automatic tools to facilitate database clustering • To generalize clustering algorithms
Generating Extended Data Sets Froma Structured Database Database d1, d2, …, dn User’s interests and objectives Extended data set generator Extended data set1
A Unified Similarity Measure for Clustering Extended Data Sets Group Similarity Measures Mixed Types: qualitative, quantitative types. Qualitative type: Tversky’s set-theoretical similarity models. • Contrast model S(a,b) = f(AB) f(A B) f(B A), where a and b be two objects, and A and B denote the sets of featuresfor some , , 0; f is the cardinality of the set • Ratio model (e.g., normalized similarity) S(a,b) = f(AB) / [f(AB) + f(A B) + f(B A)], , 0
Group Similarity Measures... continued Quantitative type: group average • Group average between group A and B where n is the total number of object-pairs, d(a,b)i is the dissimilarity measure for the ith pair of objects a and b, aA, b B. • By taking the average of all the inter-object measures for those pairs of objects from which each object of a pair is in different groups.
A Framework for Mixed Type Similarity Measures for Extended Data Sets • Gower’s similarity measure for data sets with mixed-types. • Extended similarity measure for multi-valued data sets with mixed-types. where m = l + q. The functions, sl(a,b) and sq(a,b) are similarity functions for qualitative attributes and quantitative attributes respectively.
Clustering Algorithms for Extended Data Sets • Nearest-neighbor clustering • DBSCAN • Leader algorithm • Hierarchical clustering
Database Clustering Environment A set of clusters Library of clustering algorithms Extended Data set Similarity measure Clustering Tool Library of similarity measures Similarity Measure Tool Data Extraction Tool User Interface Type and weight information Default choice and domain information DBMS
A Join Template Form A Join Template Form Begin-spec Database-name:DB; Link-definitions:Link-list; Begin-join Dataset-of-interest:Dsetintrest; Selected-attributes:Attr-list; Objective-attributes:Obj-attr-list; Extended-data-set: E; End-join End-spec
An Example of the Interface of the Extended Data Set Generation Tool Begin-spec DB-name: Company Link-definitions: superv(Employee.ssn, Employee.superssn), husband(Employee.ssn, Marriage.hssn), wife(Employee.ssn,Marriage.wssn), ehusband(Marriage.hssn, Employee.ssn), ewife(Marriage.wssn, Employee.ssn), works_on(Employee.ssn, Works_on.essn), project(Works_on.pno, Project.pnum), works_for(Employee.dno, Department.dnum), works_loc(Department.dnum, Dept_loc.dnum) Begin-join Dateset-of-interest: Employee Selected-attributes: ssn, sex, salary, superv.salary, wife.ewife.salary, works_on.hours, works_on.project.pname, works_for.works_loc.dloc Objective-attributes: ssn Output-data-set: E1 End-join End-spec
Algorithm to Generate Extended Data Sets • Project the Data Set of Interest by Primary key and Selected Attributes • Join the Data set of Interest and related data sets to get all related attributes for each join-path • Group attributes together that describe the same object
Summary Representation • Our approach uses database queries as our summary representation language. • Queries that compute the objects belonging to a cluster and no other objects are considered to be perfect summaries for a cluster. An example query for a cluster (SELECT ssn name address FROM person purchase WHERE (amount-spent > 1000) and (payment-type = ‘cash’)and (store-name = ‘flea-market’)) “Typically, members in the cluster have spent more than $1,000 cash for shopping in a flea-market”
Summary and Contributions • Discussed the data model discrepancy between database storage format and input data format for traditional clustering algorithms • Discussed the problems of dealing with relationship information in database clustering • Presented a different way of representing related information using extended data sets • Introduced the design and architecture of an automatic tools to generate extended data sets from databases • Generalized the traditional similarity measures and present a framework to cope with extended data sets in similarity-based clustering
Architecture of MASSON g1 cluster Clustering module g2 ... Object set Schema information gk user input system input user interface GP based discovery system generate apply DBMS DB select Query set Interface user input KB GP engine Domain knowledge Query result evaluate return system input Discovered query set
Evolution Process Generationn Initial generation generation2 evolve evolve evolved population Initial population evolved population qn1, qn2,..,qnm q11, q12,..,q1m q21, q22,..,q2m selection crossover mutation selection crossover mutation selection Solution Q n: number of generation m: the size of population
Evolution Process Generationn Initial generation generation2 evolve evolve evolved population Initial population evolved population qn1, qn2,..,qnm q11, q12,..,q1m q21, q22,..,q2m selection crossover mutation selection crossover mutation selection Solution Q n: number of generation m: the size of population