Download
1 / 23
230 likes | 360 Views
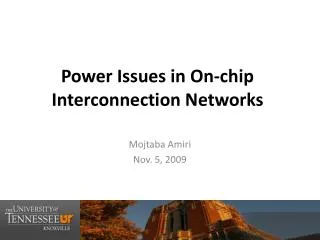
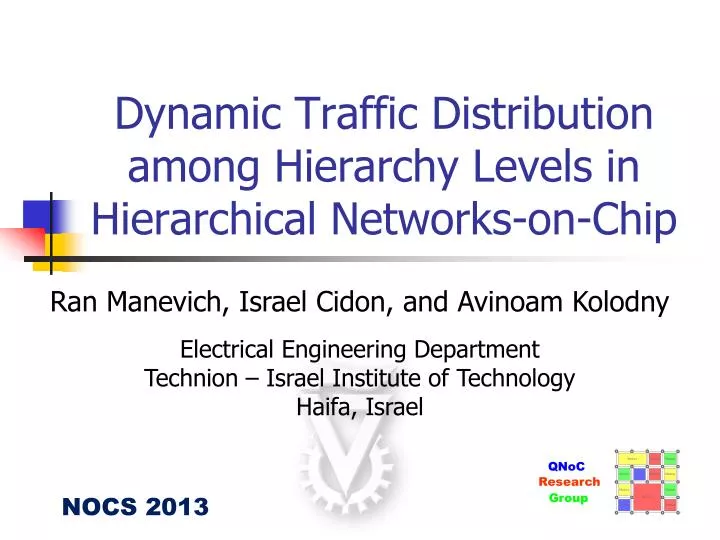
Dynamic Traffic Distribution among Hierarchy Levels in Hierarchical Networks-on-Chip. Ran Manevich, Israel Cidon, and Avinoam Kolodny . Electrical Engineering Department Technion – Israel Institute of Technology Haifa, Israel. QNoC. Research. Group. NOCS 2013.

E N D
Dynamic Traffic Distribution among Hierarchy Levels in Hierarchical Networks-on-Chip Ran Manevich, Israel Cidon, and Avinoam Kolodny Electrical Engineering Department Technion – Israel Institute of Technology Haifa, Israel QNoC Research Group NOCS 2013
Hierarchical un-clustered NoCs Hierarchical Rings S. Bourduas and, Z. Zilic, “Latency reduction of global traffic in wormhole-routed meshes using hierarchical rings for global routing.” ASAP 2007. PyraMesh • R. Manevich, I Cidon and, A. Kolodny. “Handling global traffic in future CMP NoCs” SLIP 2012.
Routing in hierarchical NoCs Phase 1 Ascent to the highest level (LMAX). • Phase 2 • Travel on LMAX towards the destination. • Phase 3 • Descent from LMAX and reach the destination.
Traffic distribution among hierarchy levels Highest level LMAX defines distribution of traffic among hierarchy levels. LMAX =2 LMAX =3 LMAX =1
Packets distribution policy • Highest Level LMAX defined by the hop distance (D) a packet would travel at the bottom level. • DThi – Distance Threshold of level i. • If D > DThi , the packet is directed to level i+1. • Example: DThi= 6, 12, 20
How to distribute traffic among hierarchy levels? SHORTEST PATH?
Shortest path – light load 8x8 PyraMesh, 3D illustration Average latencyHierarchical< Average latencyFlat
Shortest path – heavy load Congestion!!! Shortest path, but not for all? 8x8 PyraMesh, 3D illustration The upper levels are sparse! Average latencyHierarchical>> Average latencyFlat
Shortest path only for distant packets – heavy load Average latencyHierarchical< Average latencyFlat
Shortest path only for distant packets – light load Dynamic Traffic Distribution ! Dynamic Traffic Distribution!!! Average latency in “shortest path for all” is lower!
Traffic distribution – static vs. dynamic Static Traffic Distribution (STrD): Traffic distribution remains constant DThi = const Dynamic Traffic Distribution (DTrD): Traffic Distribution is adapted to the traffic conditions DThi = DThi (t)
Dynamic traffic distribution – Two modes At light traffic loads: DThi, Hop-Distance– Minimize hop-distance, optimal for light load and high traffic locality. Congestion at the upper levels under heavy loads. Under heavy loads: DThi, Load-Balance– Balanced traffic distribution among hierarchy levels. Optimal for heavy-load and low traffic locality. Not optimal under light loads.
Traffic Locality Model - Bandwidth Version of Rent’s Rule B – Cluster external bandwidth. k – Average bandwidth per module. G – Number of modules in a cluster. R – Rent’s exponent, 0<R<1. B = kGR G = 16 B = ∑ Greenfield et al., “Implications of Rent’s Rule for NoC Design and Its Fault-Tolerance”, NOCS 2007
Feedback Average buffers occupancy at the bottleneck level among the upperlevels:
Feedback vs. injection rate 32x32, 4 Levels PyraMesh; Rentian traffic with R = 0.8
DTrD control scheme Switch between distribution modes using 2 feedback thresholds:
System architecture and implementation costs Logic: • Feedback logic : <10K NAND gates. • Control logic : <1K gates. • Routing logic: comparable to previous schemes. Wires: • Feedback links of 4 wires to <10% of the routers. • 1 broadcast control bit to all bottom mesh routers. Communication: • 1 mode bit in head flits.
Simulation set-up HNOCS – NoC simulation framework for OMNET++ http://hnocs.eew.technion.ac.il/ Yaniv Ben-Itzhak et. al., NOCS 2011
Conclusions • Static traffic distribution (STrD) in hierarchical NoCs can optimize performance under either light or heavy traffic loads, but not both at the same time. • Dynamic traffic distribution (DTrD) provides optimal performance under both light and heavy loads. DTrD is lightweight, effective and feasible in future systems with many thousands of modules. DTrDis useful and desirable in any un-clustered hierarchical NoC.