Download
1 / 19
190 likes | 201 Views
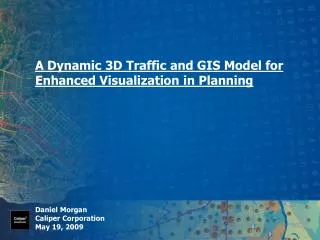
A Dynamic Traffic Simulation Model on Planning Networks. Qi Yang Caliper Corporation TRB Planning Application Conference Houston, May 20, 2009. Outline. Motivation Model structure Input Output Case study Next step. Motivation: An engine for DTA.

E N D
A Dynamic Traffic Simulation Model on Planning Networks Qi Yang Caliper Corporation TRB Planning Application ConferenceHouston, May 20, 2009
Outline • Motivation • Model structure • Input • Output • Case study • Next step
Motivation: An engine for DTA • Static traffic assignment failed to capture the temporal dimension of traffic flows • Time variant travel times (links and paths between OD pairs) • Estimation of congestion • Travel time skimming for activity based models • Dynamic ODME • Various DTA models available, and we need one which works in TransCAD
Requirements • The need to represent: • Queues, shockwaves and spillbacks • Delay at intersections and bottlenecks • Traffic signal controls at intersections • Why not microscopic traffic simulation? • Data is often not adequate to calibrate the model • Computational requirement is extensive, especially for large networks • Modelers need a cheap and fast solution because of time and budget constraints
Proposed Model:Transportation Dynamic Network Analyzer • TransDNA is a procedure which runs as a thread in TransCAD • A path-based traffic simulator for moving individual vehicles between OD pairs • “Completely” compatible with existing planning networks • Reuse (begin from) the trip matrices in planning models • Produce time-dependent travel times by links, paths, and trips • Complementary to traditional 4-step model and a tool for new activity based models
Model Structure: Work Flow 4-StepPlanning Model SeedOD Matrices TransCAD MMA Turn Movement Counts Dynamic ODME Link Travel Times Signal Timing Path Choice Model Time-Variant Matrices IntersectionTraffic Control Plans Trip Tables Path Tables Capacities TransDNA Traffic Simulation Speed &Travel Times Link and Turn Movement Counts DynamicMap Themes
Model Structure: Network Representation • Travel lanes • Added lanes on left and/or right • Movements allowed and lane grouping
Traffic Models • Delay at intersections (global or node specific) • Signalized • Unsignalized • Vehicle movements in links modeled by: • Speed/Density, or • Volume/Delay
Traffic Dynamics in Mesoscopic Simulation In Real-world In TransDNA
Van Aerde Model (1) If uc = ½ uf , kc = ½ kj c1 = c3 = 0 k and u has linear relationship Capacity Speed GreenshieldsModel Where: (2) If uc = uf , c1 = 1 / kj Free Flow Speed c2 = 0, c3 = 1 / qc – 1 / kj uf k and q has linear relationship Jam Density Capacity PipesModel Source: Hesham Rakha and Brent Crowther
Input • Network • Road classification (capacity, free flow speed, etc) • Number of lanes and their length • Travel time variability • Travel time tables • Historical • Updated • Time-dependent OD matrices • By access control (HOV, trucks, etc) • By value of time (tolls and HOT) • Intersection Signal Controls • Green splits • Delay by movements • Saturation flows by lane groups • Model parameters
Output • Trip table • Ori., Des., Path • Dep. Time, Arr. Time • Mileage, Delay • Link passage • Vehicle ID, Time Enter/Leave • Link statistics • Vehicle Count, Speed, Entry Queue • Movement counts and delay
Case Study: I-270 Corridor, MD • Subarea from PG/WashCOG • 2371 links and 928 connectors • 100,688 ODs • Simulation • 6-9:00 AM peak • 571,000 trips • Runs 10-15 times faster than real time w/ data recording on an i7 desktop (8 cores)
6:30 AM 8:30 AM 9:00 AM I-270/I-495 – Density
Case Studies – Columbus, IN • Full Planning Model • 8811 links and 984 connectors • 7225 OD pairs (85x85) • Simulation Result • 8-10 AM peak • 824,000 trips (not much congestion) • Runs 40-45 times faster than real-time on i7 desktop (8 cores)
Next Step • Complete the DTA and ODME loop • Model calibration & validation based on field data • Support user defined SD and VD functions • Testing and more testing … …