Download
1 / 26
270 likes | 496 Views
Life Cycle Assessment Energy, Material, flow. Outline. Life Cycle Analysis using example Input Output Analysis (EIOLCA) Material Flow Analysis Energy Analysis Final remarks. Life Cycle Assessment Framework. ( Source : LCA, ISO 14040 ). goal and scope.

E N D
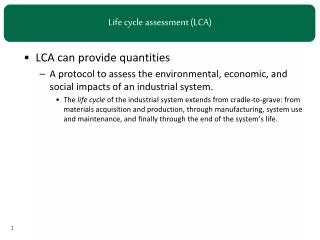
Life Cycle Assessment Energy, Material, flow
Outline • Life Cycle Analysis using example • Input Output Analysis (EIOLCA) • Material Flow Analysis • Energy Analysis • Final remarks
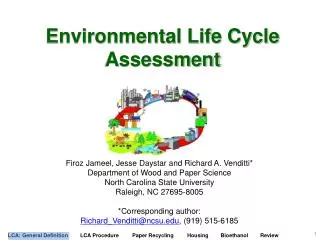
Life Cycle Assessment Framework (Source:LCA, ISO 14040)
goal and scope Environmental Life Cycle Comparison of Algae to Other Bioenergy Feedstocks, Andres et al, Environ. Sci. Technol., 2010, 44 (5), pp 1813–1819 ‘intended application, the reason for carrying it out, and to whom the results are intended.’ “...which crops are best suited......which locations...which process modification can minimize overall environmental burdens”. All environmental impacts are related to a functional unit– 317 GJ of biomass-derived energy
Boundaries and allocation • A cradle-to-gate boundary – upstream from dry mass (cultivation) • Boundaries - exclude steps with uncertainties (1) conversion of algae into liquid fuels, (2) methods to produce liquid fuels from cellulosic material in general, and (3) the benefits of creating liquid fuels versus bioelectricity. • Allocation • System expansion – the waste system was credited with the load that would have occurred had the same amount of heat been produced by an alternative source • Partition between heat emission and physical incineration waste Alternative fuel heating incineration Physical breakup
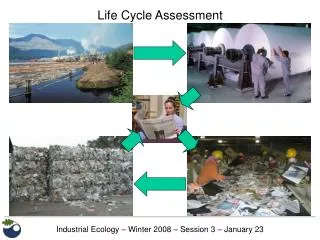
Life Cycle Inventory - LCI Make process tree or flow chart classifying events in a product’s life cycle Determine all mass and energy inputs and outputs* Collect relevant data Make assumptions for missing data Establish (correct) material and energy balance(s) for each stage and event *ecoInvent
Input ( - ) Output ( + ) Process Process 1……………Process n ??
INPUT (product flow) x (scaling parameter) = (final demand) OUTPUT (environmental flow) x (scaling parameter) = (environmental intervention)
Final demand vector Inverse matrix of technology matrix A Scaling vector Environmental intervention matrix Inventory vector (Heijung et.al, 2002) Solution:
Impact Assessment– LCIA (3) describe and indicate the impacts from inventory stage (2) aggregate the data in LCI (vector g) into fewer parameters and meaningful impacts. The resulting index is called Eco-indicator value. The higher the Eco-indicator value the stronger is the total environmental impact. 10/09/2014 12
classification the parameters are sorted into lists of the environmental • burdens • characterization relative contribution of each type are calculated • and aggregated using the equivalence factors (EcoIndicator 95): InterventionsEquivalence factorEffects CO2 1 N2O 310 global warming [CO2 equiv.] CH4 21 NO3 0,42 N tot 0,42 eutrophication [PO4 equiv.] P tot 3,06 0,33 NH3 0,13 1,88 NOx 0,7 acidification [SO2 equiv.] SO2 1 VOC 0,42 summer smog [C2H4 equiv.]
Normalization – to a known impact e.g. environmental effect caused by one person per year. weighting step – aggregating, yielding a single scalar of the environmental burden.
Weighting factors are scientific/social/political dependent Eco-indicator 95 method:
Interpretation (4) Terrestrial crops have slightly lower energy use, GHG emissions and water use than algae and higher land use and eutrophication. Algae’s environmental burdens can be substantially reduced using treated wastewater as substitute for chemical fertilizers. SSU – below terrestrial crops. “The need to minimize the upstream impacts is the first overarching outcome from this analysis.” Downstream processing (dry biomassfuel, not modelled) will probably not change the assessment given the large cultivation difference.
limitations • Data collection (inventory) is difficult; some impacts are uncertain and difficult to define. • Uncertainties in defining borders and allocations. • Time and geography are usually neglected; time and place of emissions can vary their impact. • Aggregation of the data is subjective with social and political factors contributing.
EIOLCA • EIO-LCA uses aggregate sector-level data quantifying: • Xij represents the amount that sector j purchased from sector i in a given year; yi is the "final demand" for output from sector i • monetary transactions between sectors matrix A • R – Matrix of conversion from money to environmental impact; emission releases (columns) per $ output from each sector (rows)
Emergy Analysis • Energy hierarchies • transformity
Final remarks • We reviewed several tools to examine the sustainability of systems. • Data collection poses a constraint; some systems are high dimensional. • Aggregation is subjective; reducing to one dimensional (e.g. energy) offers simplicity yet information is lost.