Download
1 / 12
120 likes | 234 Views
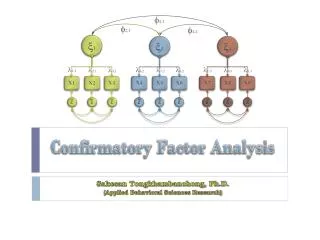
GRA 6020 Multivariate Statistics Confirmatory Factor Analysis. Ulf H. Olsson Professor of Statistics. READ: Jøreskog and Sørbom ch. 4. THURSDAY 18/3. No lecture in GRA 6020. CFA. CFA. CFA. The covariance matrices:. CFA and ML. k is the number of manifest variables.

E N D
GRA 6020Multivariate StatisticsConfirmatory Factor Analysis Ulf H. Olsson Professor of Statistics
THURSDAY 18/3 • No lecture in GRA 6020 Ulf H. Olsson
CFA Ulf H. Olsson
CFA Ulf H. Olsson
CFA • The covariance matrices: Ulf H. Olsson
CFA and ML k is the number of manifest variables. If the observed variables comes from a multivariate normal distribution, and the model holds in the population, then Ulf H. Olsson
Testing Exact Fit Ulf H. Olsson
Problems with the chi-square test • The chi-square tends to be large in large samples if the model does not hold • It is based on the assumption that the model holds in the population • It is assumed that the observed variables comes from a multivariate normal distribution • => The chi-square test might be to strict, since it is based on unreasonable assumptions?! Ulf H. Olsson
Alternative test- Testing Close fit Ulf H. Olsson
How to Use RMSEA • Use the 90% Confidence interval for EA • Use The P-value for EA • RMSEA as a descriptive Measure • RMSEA< 0.05 Good Fit • 0.05 < RMSEA < 0.08 Acceptable Fit • RMSEA > 0.10 Not Acceptable Fit Ulf H. Olsson
Other Fit Indices • CN • RMR • GFI • PGFI • Evaluation of Reliability • MI: Modification Indices Ulf H. Olsson