Download
1 / 15
150 likes | 165 Views
GRA 6020 Multivariate Statistics; The Linear Probability model and The Logit Model (Probit). Ulf H. Olsson Professor of Statistics. Binary Response Models. The Goal is to estimate the parameters. The Logit Model. The Logistic Function e ~ 2.71821828.

E N D
GRA 6020Multivariate Statistics; The Linear Probability model and The Logit Model (Probit) Ulf H. Olsson Professor of Statistics
Binary Response Models The Goal is to estimate the parameters Ulf H. Olsson
The Logit Model • The Logistic Function • e ~ 2.71821828 Ulf H. Olsson
The Logistic Curve G (The Cumulative Normal Distribution) Ulf H. Olsson
The Logit Model Ulf H. Olsson
Logit Model for Pi Ulf H. Olsson
Simple Example Ulf H. Olsson
Simple Example Ulf H. Olsson
The Logit Model • Non-linear => Non-linear Estimation =>ML • Model can be tested, but R-sq. does not work. Some pseudo R.sq. have been proposed. • Estimate a model to predict the probability Ulf H. Olsson
Binary Response Models • The magnitude of each effect is not especially useful since y* rarely has a well-defined unit of measurement. • But, it is possible to find the partial effects on the probabilities by partial derivatives. • We are interested in significance and directions (positive or negative) • To find the partial effects of roughly continuous variables on the response probability: Ulf H. Olsson
Introduction to the ML-estimator Ulf H. Olsson
Introduction to the ML-estimator • The value of the parameters that maximizes this function are the maximum likelihood estimates • Since the logarithm is a monotonic function, the values that maximizes L are the same as those that minimizes ln L Ulf H. Olsson
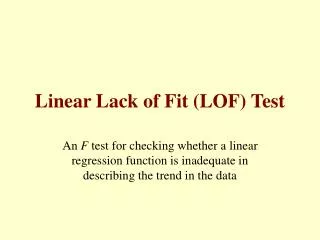
Goodness of Fit The lower the better (0 – perfect fit) Some Pseudo R-sq. The Wald test for the individual parameters Ulf H. Olsson
The Wald Test Ulf H. Olsson
Example of the Wald test • Consider a simple regression model Ulf H. Olsson