Download
1 / 42
420 likes | 492 Views
National Survey on Drug Use and Health Current Drinking Among 12 – 17 Year-olds.

E N D
National Survey on Drug Use and Health Current Drinking Among 12 – 17 Year-olds Source: 2010 National Survey on Drug Use and Health, an annual survey representative of the civilian, non-institutionalized population of the U.S. aged 12 years old or older conducted by the Substance Abuse and Mental Health Services Administration, U.S. Department of Health & Human Services, 2011: http://www.samhsa.gov/data/NSDUH/2k10ResultsTables/Web/PDFW/Sect2peTabs37to46.pdfTable 2.38B The 2010 survey is based on interviews with approximately 67,500 respondents ages 12 and older. The survey covers residents of households (living in houses/townhouses, apartments, condominiums, etc.), persons in non-institutional group quarters (e.g., shelters, rooming/boarding houses, college dormitories, migratory workers' camps, halfway houses), and civilians living on military bases. The National Survey on Drug Use and Health defines current drinkers as those who have had at least one drink in the past 30 days. Question: Think specifically about the past 30 days up to and including today. During the past 30 days, on how many days did you drink one or more drinks of an alcoholic beverage?
National Survey on Drug Use and Health Heavy Drinking Among 12 - 17 Year-olds Source: 2010 National Survey on Drug Use and Health, an annual survey representative of the civilian, non-institutionalized population of the U.S. aged 12 years old or older conducted by the Substance Abuse and Mental Health Services Administration, U.S. Department of Health & Human Services, 2011: http://www.samhsa.gov/data/NSDUH/2k10ResultsTables/Web/PDFW/Sect2peTabs37to46.pdfTable 2.43B The 2010 survey is based on interviews with approximately 67,500 respondents ages 12 and older. The survey covers residents of households (living in houses/townhouses, apartments, condominiums, etc.), persons in non-institutional group quarters (e.g., shelters, rooming/boarding houses, college dormitories, migratory workers' camps, halfway houses), and civilians living on military bases. The National Survey on Drug Use and Health defines Heavy Alcohol Use as drinking five or more drinks on the same occasion on each of 5 or more days in the past 30 days; all heavy alcohol users are also “binge” alcohol users. Question: During the past 30 days, on how many days did you drink 5 or more drinks on the same occasion? By ‘occasion’ we mean at the same time or within a couple of hours of each other.
National Survey on Drug Use and Health Current Drinking Among 12 - 17 Year-olds Source: 2010 National Survey on Drug Use and Health, an annual survey representative of the civilian, non-institutionalized population of the U.S. aged 12 years old or older conducted by the Substance Abuse and Mental Health Services Administration, U.S. Department of Health & Human Services, 2011: http://www.samhsa.gov/data/NSDUH/2k10ResultsTables/Web/PDFW/Sect2peTabs37to46.pdfTable 2.43B and Table 2.38B The 2010 survey is based on interviews with approximately 67,500 respondents ages 12 and older. The survey covers residents of households (living in houses/townhouses, apartments, condominiums, etc.), persons in non-institutional group quarters (e.g., shelters, rooming/boarding houses, college dormitories, migratory workers' camps, halfway houses), and civilians living on military bases. The National Survey on Drug Use and Health defines current drinkers as those who have had at least one drink in the past 30 days. The National Survey on Drug Use and Health defines Heavy Alcohol Use as drinking five or more drinks on the same occasion on each of 5 or more days in the past 30 days; all heavy alcohol users are also “binge” alcohol users. Question: Think specifically about the past 30 days up to and including today. During the past 30 days, on how many days did you drink one or more drinks of an alcoholic beverage?
National Survey on Drug Use and Health Drinking 5 or More Drinks on the Same OccasionAmong 12 - 17 Year-olds Source: 2010 National Survey on Drug Use and Health, an annual survey representative of the civilian, non-institutionalized population of the U.S. aged 12 years old or older conducted by the Substance Abuse and Mental Health Services Administration, U.S. Department of Health & Human Services, 2011: http://www.samhsa.gov/data/NSDUH/2k10ResultsTables/Web/PDFW/Sect2peTabs37to46.pdf Table 2.43B The 2010 survey is based on interviews with approximately 67,500 respondents ages 12 and older. The survey covers residents of households (living in houses/townhouses, apartments, condominiums, etc.), persons in non-institutional group quarters (e.g., shelters, rooming/boarding houses, college dormitories, migratory workers' camps, halfway houses), and civilians living on military bases. The National Survey on Drug Use and Health defines current drinkers as those who have had at least one drink in the past 30 days. The National Survey on Drug Use and Health defines Heavy Alcohol Use as drinking five or more drinks on the same occasion on each of 5 or more days in the past 30 days; all heavy alcohol users are also “binge” alcohol users. Question: Think specifically about the past 30 days up to and including today. During the past 30 days, on how many days did you drink one or more drinks of an alcoholic beverage?
National Survey on Drug Use and Health Current Drinking Among 12 - 20 Year-olds Source: 2010 National Survey on Drug Use and Health, an annual survey representative of the civilian, non-institutionalized population of the U.S. aged 12 years old or older conducted by the Substance Abuse and Mental Health Services Administration, U.S. Department of Health & Human Services, 2011: http://www.samhsa.gov/data/NSDUH/2k10ResultsTables/Web/PDFW/Sect2peTabs77to84.pdf Table 2.77B The 2010 survey is based on interviews with approximately 67,500 respondents ages 12 and older. The survey covers residents of households (living in houses/townhouses, apartments, condominiums, etc.), persons in non-institutional group quarters (e.g., shelters, rooming/boarding houses, college dormitories, migratory workers' camps, halfway houses), and civilians living on military bases. The National Survey on Drug Use and Health defines current drinkers as those who have had at least one drink in the past 30 days. Question: Think specifically about the past 30 days up to and including today. During the past 30 days, on how many days did you drink one or more drinks of an alcoholic beverage?
National Survey on Drug Use and Health Heavy Drinking Among 12 - 20 Year-olds Source: 2010 National Survey on Drug Use and Health, an annual survey representative of the civilian, non-institutionalized population of the U.S. aged 12 years old or older conducted by the Substance Abuse and Mental Health Services Administration, U.S. Department of Health & Human Services, 2011: http://www.samhsa.gov/data/NSDUH/2k10ResultsTables/Web/PDFW/Sect2peTabs77to84.pdfTable 2.79B The 2010 survey is based on interviews with approximately 67,500 respondents ages 12 and older. The survey covers residents of households (living in houses/townhouses, apartments, condominiums, etc.), persons in non-institutional group quarters (e.g., shelters, rooming/boarding houses, college dormitories, migratory workers' camps, halfway houses), and civilians living on military bases. The National Survey on Drug Use and Health defines Heavy Alcohol Use as drinking five or more drinks on the same occasion on each of 5 or more days in the past 30 days; all heavy alcohol users are also “binge” alcohol users. Question: During the past 30 days, on how many days did you drink 5 or more drinks on the same occasion? By ‘occasion’ we mean at the same time or within a couple of hours of each other.
National Survey on Drug Use and Health Drinking 5 or More Drinks on the Same OccasionAmong 12 - 20 Year-olds Source: 2010 National Survey on Drug Use and Health, an annual survey representative of the civilian, non-institutionalized population of the U.S. aged 12 years old or older conducted by the Substance Abuse and Mental Health Services Administration, U.S. Department of Health & Human Services, 2011: http://www.samhsa.gov/data/NSDUH/2k10ResultsTables/Web/PDFW/Sect2peTabs77to84.pdfTable 2.79B The 2010 survey is based on interviews with approximately 67,500 respondents ages 12 and older. The survey covers residents of households (living in houses/townhouses, apartments, condominiums, etc.), persons in non-institutional group quarters (e.g., shelters, rooming/boarding houses, college dormitories, migratory workers' camps, halfway houses), and civilians living on military bases. The National Survey on Drug Use and Health defines Heavy Alcohol Use as drinking five or more drinks on the same occasion on each of 5 or more days in the past 30 days; all heavy alcohol users are also “binge” alcohol users. Question: During the past 30 days, on how many days did you drink 5 or more drinks on the same occasion? By ‘occasion’ we mean at the same time or within a couple of hours of each other.
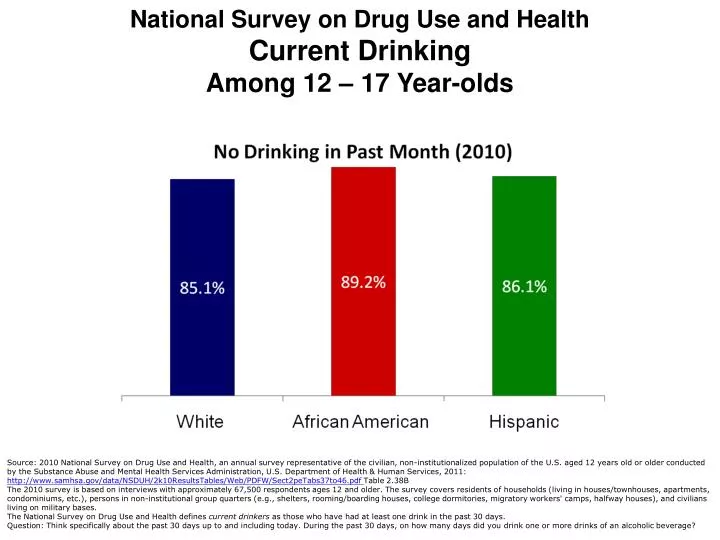
National Survey on Drug Use and Health Current (past month) Use of Alcohol Among Persons Aged 12 – 17, by Race/Ethnicity Source: 2010 National Survey on Drug Use and Health, an annual survey representative of the civilian, non-institutionalized population of the U.S. aged 12 years old or older conducted by the Substance Abuse and Mental Health Services Administration, U.S. Department of Health & Human Services, 2011: http://www.oas.samhsa.gov/NSDUH/2k9NSDUH/tabs/Sect2peTabs43to84.htm#Tab2.43B Table 2.38B The 2010 survey is based on interviews with approximately 67,500 respondents ages 12 and older. The survey covers residents of households (living in houses/townhouses, apartments, condominiums, etc.), persons in non-institutional group quarters (e.g., shelters, rooming/boarding houses, college dormitories, migratory workers' camps, halfway houses), and civilians living on military bases. The National Survey on Drug Use and Health defines current drinkers as those who have had at least one drink in the past 30 days. Question: Think specifically about the past 30 days up to and including today. During the past 30 days, on how many days did you drink one or more drinks of an alcoholic beverage?
National Survey on Drug Use and Health Five or More Drinks on the Same Occasion in the Past Month Among Persons Aged 12 – 17, by Race/Ethnicity Source: 2010 National Survey on Drug Use and Health, an annual survey representative of the civilian, non-institutionalized population of the U.S. aged 12 years old or older conducted by the Substance Abuse and Mental Health Services Administration, U.S. Department of Health & Human Services, 2011: http://www.oas.samhsa.gov/NSDUH/2k9NSDUH/tabs/Sect2peTabs43to84.htm#Tab2.43B Table 2.43B The 2010 survey is based on interviews with approximately 67,500 respondents ages 12 and older. The survey covers residents of households (living in houses/townhouses, apartments, condominiums, etc.), persons in non-institutional group quarters (e.g., shelters, rooming/boarding houses, college dormitories, migratory workers' camps, halfway houses), and civilians living on military bases. Drinking five or more drinks on the same occasion on at least 1 day in the past 30 days. By occasion is meant at the same time or within a couple hours of each other. Question: During the past 30 days, on how many days did you have 5 or more drinks on the same occasion? By ‘occasion,’ we mean at the same time or within a couple of hours of each other.
National Survey on Drug Use and Health Current (past month) Use of Alcohol Among Persons Aged 12 – 20, by Race/Ethnicity Source: 2010 National Survey on Drug Use and Health, an annual survey representative of the civilian, non-institutionalized population of the U.S. aged 12 years old or older conducted by the Substance Abuse and Mental Health Services Administration, U.S. Department of Health & Human Services, 2011: http://www.samhsa.gov/data/NSDUH/2k10ResultsTables/Web/PDFW/Sect2peTabs77to84.pdfTable 2.77B The 2010 survey is based on interviews with approximately 67,500 respondents ages 12 and older. The survey covers residents of households (living in houses/townhouses, apartments, condominiums, etc.), persons in non-institutional group quarters (e.g., shelters, rooming/boarding houses, college dormitories, migratory workers' camps, halfway houses), and civilians living on military bases. The National Survey on Drug Use and Health defines current drinkers as those who have had at least one drink in the past 30 days. Question: Think specifically about the past 30 days up to and including today. During the past 30 days, on how many days did you drink one or more drinks of an alcoholic beverage?
National Survey on Drug Use and Health Five or More Drinks on the Same Occasion in the Past Month Among Persons Aged 12 – 20, by Race/Ethnicity Source: 2010 National Survey on Drug Use and Health, an annual survey representative of the civilian, non-institutionalized population of the U.S. aged 12 years old or older conducted by the Substance Abuse and Mental Health Services Administration, U.S. Department of Health & Human Services, 2011: http://www.samhsa.gov/data/NSDUH/2k10ResultsTables/Web/PDFW/Sect2peTabs77to84.pdf Table 2.79B The 2010 survey is based on interviews with approximately 67,500 respondents ages 12 and older. The survey covers residents of households (living in houses/townhouses, apartments, condominiums, etc.), persons in non-institutional group quarters (e.g., shelters, rooming/boarding houses, college dormitories, migratory workers' camps, halfway houses), and civilians living on military bases. Drinking five or more drinks on the same occasion on at least 1 day in the past 30 days. By “occasion” is meant at the same time or within a couple hours of each other. Question: During the past 30 days, on how many days did you have 5 or more drinks on the same occasion? By ‘occasion,’ we mean at the same time or within a couple of hours of each other.
The American Freshmen Survey Percentage of College Freshmen Who Drank Beer Frequently or Occasionally 25% decrease since 1971 69% decrease since 1971 42% decrease since 1971 Source: The American Freshman Survey, sponsored by UCLA and conducted by the Higher Education Research Institute at UCLA’s Graduate School of Education & Information Studies. The 2010 freshman norms are based on the responses of 201,818 first-time, full-time students at 279 of the nation's baccalaureate colleges and universities. The data have been statistically adjusted to reflect the responses of the 1.5 million first-time, full-time students entering four year colleges and universities as freshmen in 2010. Since 1966, the first year the survey was conducted, more than 15 million incoming first year students at 1,900 colleges and universities nationwide have participated. The CIRP Freshmen Survey is the largest and longest-running survey of American college students. http://heri.ucla.edu/pr-display.php?prQry=55 Note- 2010 African American sample size is 11,469. 2010 White sample size is 126,168. Question: For the activities below, indicate which ones you did during the past year. If you engaged in an activity frequently, mark Frequently. If you engaged in an activity one or more times, but not frequently, mark Occasionally. Mark Not at all if you have not performed the activity during the past year. (Drank beer, Drank wine or liquor)
The American Freshmen Survey Percentage of College Freshmen Who Drank Beer Occasionally 21% decrease since 1971 68% decrease since 1971 40% decrease since 1971 Source: The American Freshman Survey, sponsored by UCLA and conducted by the Higher Education Research Institute at UCLA’s Graduate School of Education & Information Studies. The 2010 freshman norms are based on the responses of 201,818 first-time, full-time students at 279 of the nation's baccalaureate colleges and universities. The data have been statistically adjusted to reflect the responses of the 1.5 million first-time, full-time students entering four year colleges and universities as freshmen in 2010. Since 1966, the first year the survey was conducted, more than 15 million incoming first year students at 1,900 colleges and universities nationwide have participated. The CIRP Freshmen Survey is the largest and longest-running survey of American college students. http://heri.ucla.edu/pr-display.php?prQry=55 Note- 2010 African American sample size is 11,469. 2010 White sample size is 126,168. Question: For the activities below, indicate which ones you did during the past year. If you engaged in an activity frequently, mark Frequently. If you engaged in an activity one or more times, but not frequently, mark Occasionally. Mark Not at all if you have not performed the activity during the past year. (Drank beer, Drank wine or liquor)
The American Freshmen Survey Percentage of College Freshmen Who Drank Beer Frequently 36% decrease since 1971 76% decrease since 1971 51% decrease since 1971 Source: The American Freshman Survey, sponsored by UCLA and conducted by the Higher Education Research Institute at UCLA’s Graduate School of Education & Information Studies. The 2010 freshman norms are based on the responses of 201,818 first-time, full-time students at 279 of the nation's baccalaureate colleges and universities. The data have been statistically adjusted to reflect the responses of the 1.5 million first-time, full-time students entering four year colleges and universities as freshmen in 2010. Since 1966, the first year the survey was conducted, more than 15 million incoming first year students at 1,900 colleges and universities nationwide have participated. The CIRP Freshmen Survey is the largest and longest-running survey of American college students. http://heri.ucla.edu/pr-display.php?prQry=55 Note- 2010 African American sample size is 11,469. 2010 White sample size is 126,168. Question: For the activities below, indicate which ones you did during the past year. If you engaged in an activity frequently, mark Frequently. If you engaged in an activity one or more times, but not frequently, mark Occasionally. Mark Not at all if you have not performed the activity during the past year. (Drank beer, Drank wine or liquor)
Centers For Disease Control Youth Risk Behavior Survey High School Students Consumed At Least One Drink of Alcohol in the Past 30 Days 16% decrease since 1991 21% decrease since 1991 21% decrease since 1991 Source: Youth Risk Behavior Survey (YRBS), Centers for Disease Control and Prevention. The YRBS is an in-school survey of students in grades 9 through 12. Students completed self-administered questionnaires in their classrooms. In 2009, the national sample consisted of 16,460 responses from 158 schools. http://www.cdc.gov/mmwr/pdf/ss/ss5905.pdf Note to surveyed: This includes drinking beer, wine, wine coolers, and liquor such as rum, gin, vodka, or whiskey. For these questions, drinking alcohol does not include drinking a few sips of wine for religious purposes. Question: During the past 30 days, on how many days did you have at least one drink of alcohol? (0 days, 1 or 2 days, 3 to 5 days, 6 to 9 days, 10 to 19 days, 20 to 29 days, All 30 days)
Centers For Disease Control Youth Risk Behavior Survey High School Students Consumed Five or More Drinks of Alcohol in a Row in the Past 30 Days* 20% decrease since 1991 25% decrease since 1991 19% decrease since 1991 Source: Youth Risk Behavior Survey (YRBS), Centers for Disease Control and Prevention. The YRBS is an in-school survey of students in grades 9 through 12. Students completed self-administered questionnaires in their classrooms. In 2009, the national sample consisted of 16,460 responses from 158 schools. http://www.cdc.gov/mmwr/pdf/ss/ss5905.pdf *“in a row, that is, within a couple of hours on one or more of the past 30 days.” Note to surveyed: This includes drinking beer, wine, wine coolers, and liquor such as rum, gin, vodka, or whiskey. For these questions, drinking alcohol does not include drinking a few sips of wine for religious purposes. Question: During the past 30 days, on how many days did you have 5 or more drinks of alcohol in a row, that is, within a couple of hours? (0 days, 1 day, 2 days, 3 to 5 days, 6 to 9 days, 10 to 19 days, 20 or more days)
Centers For Disease Control Youth Risk Behavior Survey High School Students Students Who Had Their First Drink of Alcohol Other Than a Few Sips Before Age 13 Source: Youth Risk Behavior Survey (YRBS), Centers for Disease Control and Prevention. The YRBS is an in-school survey of students in grades 9 through 12. Students completed self-administered questionnaires in their classrooms. In 2009, the national sample consisted of 16,460 responses from 158 schools. http://www.cdc.gov/mmwr/pdf/ss/ss5905.pdf Note to surveyed: This includes drinking beer, wine, wine coolers, and liquor such as rum, gin, vodka, or whiskey. For these questions, drinking alcohol does not include drinking a few sips of wine for religious purposes. Question: How old were you when you had your first drink of alcohol other than a few sips? (I have never had a drink of alcohol other than a few sips, 8 years old or younger, 9 or 10 years old, 11 or 12 years old, 13 or 14 years old, 15 or 16 years old, 17 years old or older)
Centers For Disease Control Youth Risk Behavior Survey High School Students Consumed At Least One Drink of Alcohol on One or More Days During Their Life 11% decrease since 1991 14% decrease since 1991 10% decrease since 1991 Source: Youth Risk Behavior Survey (YRBS), Centers for Disease Control and Prevention. The YRBS is an in-school survey of students in grades 9 through 12. Students completed self-administered questionnaires in their classrooms. In 2009, the national sample consisted of 16,460 responses from 158 schools. http://www.cdc.gov/mmwr/pdf/ss/ss5905.pdf Note to surveyed: This includes drinking beer, wine, wine coolers, and liquor such as rum, gin, vodka, or whiskey. For these questions, drinking alcohol does not include drinking a few sips of wine for religious purposes. Question: During your life, on how many days have you had at least one drink of alcohol? (0 days, 1 or 2 days, 3 to 9 days, 10 to 19 days, 20 to 39 days, 40 to 99 days, 100 or more days)
Centers For Disease Control Youth Risk Behavior Survey High School Students Had At Least One Drink Of Alcohol On School Property 28% decrease since 1993 22% decrease since 1993 1.5% increase since 1993 Source: Youth Risk Behavior Survey (YRBS), Centers for Disease Control and Prevention. The YRBS is an in-school survey of students in grades 9 through 12. Students completed self-administered questionnaires in their classrooms. In 2009, the national sample consisted of 16,460 responses from 158 schools. http://www.cdc.gov/mmwr/pdf/ss/ss5905.pdf Note to surveyed: This includes drinking beer, wine, wine coolers, and liquor such as rum, gin, vodka, or whiskey. For these questions, drinking alcohol does not include drinking a few sips of wine for religious purposes. Question: During the past 30 days, on how many days did you have at least one drink of alcohol on school property? (0 days, 1 or 2 days, 3 to 5 days, 6 to 9 days, 10 to 19 days, 20 to 29 days, All 30 days)
Centers For Disease Control Youth Risk Behavior Survey High School Students Drove A Car When They Had Been Drinking (Past 30 Days) 42% decrease since 1991 35% decrease since 1991 45% decrease since 1991 Source: Youth Risk Behavior Survey (YRBS), Centers for Disease Control and Prevention. The YRBS is an in-school survey of students in grades 9 through 12. Students completed self-administered questionnaires in their classrooms. In 2009, the national sample consisted of 16,460 responses from 158 schools. http://www.cdc.gov/mmwr/pdf/ss/ss5905.pdf Note to surveyed: This includes drinking beer, wine, wine coolers, and liquor such as rum, gin, vodka, or whiskey. For these questions, drinking alcohol does not include drinking a few sips of wine for religious purposes. Question: During the past 30 days, how many times did you drive a car or other vehicle when you had been drinking alcohol? (0 times, 1 time, 2 or 3 times, 4 or 5 times, 6 or more times)
Centers For Disease Control Youth Risk Behavior Survey High School Students Rode In A Car Driven By Someone Who Had Been Drinking (Past 30 Days) 35% decrease since 1991 15% decrease since 1991 27% decrease since 1991 Source: Youth Risk Behavior Survey (YRBS), Centers for Disease Control and Prevention. The YRBS is an in-school survey of students in grades 9 through 12. Students completed self-administered questionnaires in their classrooms. In 2009, the national sample consisted of 16,460 responses from 158 schools. http://www.cdc.gov/mmwr/pdf/ss/ss5905.pdf Note to surveyed: This includes drinking beer, wine, wine coolers, and liquor such as rum, gin, vodka, or whiskey. For these questions, drinking alcohol does not include drinking a few sips of wine for religious purposes. Question: During the past 30 days, how many times did you ride in a car or other vehicle driven by someone who had been drinking alcohol? (0 times, 1 time, 2 or 3 times, 4 or 5 times, 6 or more times)
Monitoring the Future Thirty-Day Prevalence for 8th Graders – Alcohol By Race 48% decrease since 1992 37% decrease since 1992 42% decrease since 1992 SOURCE: The Monitoring the Future Study, the University of Michigan. http://www.monitoringthefuture.org/pubs/monographs/mtf-vol1_2010.pdf Table D-73 The sample sizes in 2010 are 15,769 eighth graders in 147 schools, 15,586 tenth graders in 123 schools, and 15,127 twelfth graders in 126 schools, for a total of 46,482 students in 396 secondary schools. The samples are drawn separately at each grade level to be representative of students in that grade in public and private secondary schools across the coterminous United States. To derive percentages for each racial subgroup, data for the specified year and the previous year have been combined to increase subgroup sample sizes and thus provide more stable estimates. Question: On how many occasions (if any) have you had alcohol to drink– more than just a few sips during the last 30 days? (0 Occasions, 1-2 Occasions, 3-5 Occasions, 6-9 Occasions, 10-19 Occasions, 20-39 Occasions, 40 or More)
Monitoring the Future Thirty-Day Prevalence for 8th Graders – Beer By Race 36% decrease since 1992 56% decrease since 1992 44% decrease since 1992 SOURCE: The Monitoring the Future Study, the University of Michigan. http://www.monitoringthefuture.org/pubs/monographs/mtf-vol1_2010.pdf Table D-82 The sample sizes in 2010 are 15,769 eighth graders in 147 schools, 15,586 tenth graders in 123 schools, and 15,127 twelfth graders in 126 schools, for a total of 46,482 students in 396 secondary schools. The samples are drawn separately at each grade level to be representative of students in that grade in public and private secondary schools across the coterminous United States. To derive percentages for each racial subgroup, data for the specified year and the previous year have been combined to increase subgroup sample sizes and thus provide more stable estimates. Question: On how many occasions (if any) have you had beer to drink during the last 30 days? (0 Occasions, 1-2 Occasions, 3-5 Occasions, 6-9 Occasions, 10-19 Occasions, 20-39 Occasions, 40 or More)
Monitoring the Future Two-Week Prevalence for 8th Graders 5+ Drinks in a Row – Beer By Race 31% decrease since 1992 71% decrease since 1992 44% decrease since 1992 SOURCE: The Monitoring the Future Study, the University of Michigan. http://www.monitoringthefuture.org/pubs/monographs/mtf-vol1_2010.pdf Table D-85 The sample sizes in 2010 are 15,769 eighth graders in 147 schools, 15,586 tenth graders in 123 schools, and 15,127 twelfth graders in 126 schools, for a total of 46,482 students in 396 secondary schools. The samples are drawn separately at each grade level to be representative of students in that grade in public and private secondary schools across the coterminous United States. To derive percentages for each racial subgroup, data for the specified year and the previous year have been combined to increase subgroup sample sizes and thus provide more stable estimates. Question: Think back over the last two weeks. How many times have you had five or more 12-ounce cans of beer (or the equivalent) in a row? (None, Once, Twice, 3 to 5 times, 6 to 9 times, 10 or more times)
Monitoring the Future Thirty-Day Prevalence for 8th Graders – Been Drunk By Race 31% decrease since 1992 37% decrease since 1992 41% decrease since 1992 SOURCE: The Monitoring the Future Study, the University of Michigan. http://www.monitoringthefuture.org/pubs/monographs/mtf-vol1_2010.pdf Table D-76 The sample sizes in 2010 are 15,769 eighth graders in 147 schools, 15,586 tenth graders in 123 schools, and 15,127 twelfth graders in 126 schools, for a total of 46,482 students in 396 secondary schools. The samples are drawn separately at each grade level to be representative of students in that grade in public and private secondary schools across the coterminous United States. To derive percentages for each racial subgroup, data for the specified year and the previous year have been combined to increase subgroup sample sizes and thus provide more stable estimates. Question: On how many occasions (if any) have you been drunk or very high from drinking alcoholic beverages during the last 30 days? (0 Occasions, 1-2 Occasions, 3-5 Occasions, 6-9 Occasions, 10-19 Occasions, 20-39 Occasions, 40 or More)
Monitoring the Future Two-Week Prevalence for 8th Graders 5+ Drinks in a Row – Alcohol By Race 37% decrease since 1992 18% decrease since 1992 35% decrease since 1992 SOURCE: The Monitoring the Future Study, the University of Michigan. http://www.monitoringthefuture.org/pubs/monographs/mtf-vol1_2010.pdf Table D-79 The sample sizes in 2010 are 15,769 eighth graders in 147 schools, 15,586 tenth graders in 123 schools, and 15,127 twelfth graders in 126 schools, for a total of 46,482 students in 396 secondary schools. The samples are drawn separately at each grade level to be representative of students in that grade in public and private secondary schools across the coterminous United States. To derive percentages for each racial subgroup, data for the specified year and the previous year have been combined to increase subgroup sample sizes and thus provide more stable estimates. Question: Think back over the last two weeks. How many times have you had five or more drinks in a row? (None, Once, Twice, 3 to 5 times, 6 to 9 times, 10 or more times)
Monitoring the Future Thirty-Day Prevalence for 10th Graders – Alcohol By Race 30% decrease since 1992 31% decrease since 1992 15% decrease since 1992 SOURCE: The Monitoring the Future Study, the University of Michigan. http://www.monitoringthefuture.org/pubs/monographs/mtf-vol1_2010.pdf Table D-74 The sample sizes in 2010 are 15,769 eighth graders in 147 schools, 15,586 tenth graders in 123 schools, and 15,127 twelfth graders in 126 schools, for a total of 46,482 students in 396 secondary schools. The samples are drawn separately at each grade level to be representative of students in that grade in public and private secondary schools across the coterminous United States. To derive percentages for each racial subgroup, data for the specified year and the previous year have been combined to increase subgroup sample sizes and thus provide more stable estimates. Question: On how many occasions (if any) have you had alcohol to drink– more than just a few sips during the last 30 days? (0 Occasions, 1-2 Occasions, 3-5 Occasions, 6-9 Occasions, 10-19 Occasions, 20-39 Occasions, 40 or More)
Monitoring the Future Thirty-Day Prevalence for 10th Graders – Beer By Race 26% decrease since 1992 40% decrease since 1992 7% decrease since 1992 SOURCE: The Monitoring the Future Study, the University of Michigan. http://www.monitoringthefuture.org/pubs/monographs/mtf-vol1_2010.pdf Table D-83 The sample sizes in 2010 are 15,769 eighth graders in 147 schools, 15,586 tenth graders in 123 schools, and 15,127 twelfth graders in 126 schools, for a total of 46,482 students in 396 secondary schools. The samples are drawn separately at each grade level to be representative of students in that grade in public and private secondary schools across the coterminous United States. To derive percentages for each racial subgroup, data for the specified year and the previous year have been combined to increase subgroup sample sizes and thus provide more stable estimates. Question: On how many occasions (if any) have you had beer to drink during the last 30 days? (0 Occasions, 1-2 Occasions, 3-5 Occasions, 6-9 Occasions, 10-19 Occasions, 20-39 Occasions, 40 or More)
Monitoring the Future Thirty-Day Prevalence for 10th Graders – Been Drunk By Race 24% decrease since 1992 1% decrease since 1992 3% decrease since 1992 SOURCE: The Monitoring the Future Study, the University of Michigan. http://www.monitoringthefuture.org/pubs/monographs/mtf-vol1_2010.pdfTable D-77 The sample sizes in 2010 are 15,769 eighth graders in 147 schools, 15,586 tenth graders in 123 schools, and 15,127 twelfth graders in 126 schools, for a total of 46,482 students in 396 secondary schools. The samples are drawn separately at each grade level to be representative of students in that grade in public and private secondary schools across the coterminous United States. To derive percentages for each racial subgroup, data for the specified year and the previous year have been combined to increase subgroup sample sizes and thus provide more stable estimates. Question: On how many occasions (if any) have you been drunk or very high from drinking alcoholic beverages during the last 30 days? (0 Occasions, 1-2 Occasions, 3-5 Occasions, 6-9 Occasions, 10-19 Occasions, 20-39 Occasions, 40 or More)
Monitoring the Future Two-Week Prevalence for 10th Graders 5+ Drinks in a Row – Alcohol By Race 20% decrease since 1992 13% decrease since 1992 9% increase since 1992 SOURCE: The Monitoring the Future Study, the University of Michigan. http://www.monitoringthefuture.org/pubs/monographs/mtf-vol1_2010.pdf Table D-80 The sample sizes in 2010 are 15,769 eighth graders in 147 schools, 15,586 tenth graders in 123 schools, and 15,127 twelfth graders in 126 schools, for a total of 46,482 students in 396 secondary schools. The samples are drawn separately at each grade level to be representative of students in that grade in public and private secondary schools across the coterminous United States. To derive percentages for each racial subgroup, data for the specified year and the previous year have been combined to increase subgroup sample sizes and thus provide more stable estimates. Question: Think back over the last two weeks. How many times have you had five or more drinks in a row? (None, Once, Twice, 3 to 5 times, 6 to 9 times, 10 or more times)
Monitoring the Future Two-Week Prevalence for 10th Graders 5+ Drinks in a Row – Beer By Race 32% decrease since 1992 55% decrease since 1992 No change from 1992 SOURCE: The Monitoring the Future Study, the University of Michigan. http://www.monitoringthefuture.org/pubs/monographs/mtf-vol1_2010.pdf Table D-86 The sample sizes in 2010 are 15,769 eighth graders in 147 schools, 15,586 tenth graders in 123 schools, and 15,127 twelfth graders in 126 schools, for a total of 46,482 students in 396 secondary schools. The samples are drawn separately at each grade level to be representative of students in that grade in public and private secondary schools across the coterminous United States. To derive percentages for each racial subgroup, data for the specified year and the previous year have been combined to increase subgroup sample sizes and thus provide more stable estimates. Question: Think back over the last two weeks. How many times have you had five or more 12-ounce cans of beer (or the equivalent) in a row? (None, Once, Twice, 3 to 5 times, 6 to 9 times, 10 or more times)
Monitoring the Future Thirty-Day Prevalence for 12th Graders – Been Drunk By Race 9% decrease since 1992 34% increase since 1992 25% decrease since 1992 SOURCE: The Monitoring the Future Study, the University of Michigan. http://www.monitoringthefuture.org/pubs/monographs/mtf-vol1_2010.pdf Table D-78 The sample sizes in 2010 are 15,769 eighth graders in 147 schools, 15,586 tenth graders in 123 schools, and 15,127 twelfth graders in 126 schools, for a total of 46,482 students in 396 secondary schools. The samples are drawn separately at each grade level to be representative of students in that grade in public and private secondary schools across the coterminous United States. To derive percentages for each racial subgroup, data for the specified year and the previous year have been combined to increase subgroup sample sizes and thus provide more stable estimates. Question: On how many occasions (if any) have you been drunk or very high from drinking alcoholic beverages during the last 30 days? (0 Occasions, 1-2 Occasions, 3-5 Occasions, 6-9 Occasions, 10-19 Occasions, 20-39 Occasions, 40 or More)
Monitoring the Future Thirty-Day Prevalence for 12th Graders – Alcohol By Race 38% decrease since 1977 37% increase since 1977 36% decrease since 1977 SOURCE: The Monitoring the Future Study, the University of Michigan. http://www.monitoringthefuture.org/pubs/monographs/mtf-vol1_2010.pdf Table D-75 The sample sizes in 2010 are 15,769 eighth graders in 147 schools, 15,586 tenth graders in 123 schools, and 15,127 twelfth graders in 126 schools, for a total of 46,482 students in 396 secondary schools. The samples are drawn separately at each grade level to be representative of students in that grade in public and private secondary schools across the coterminous United States. To derive percentages for each racial subgroup, data for the specified year and the previous year have been combined to increase subgroup sample sizes and thus provide more stable estimates. Question: On how many occasions (if any) have you had alcohol to drink– more than just a few sips during the last 30 days? (0 Occasions, 1-2 Occasions, 3-5 Occasions, 6-9 Occasions, 10-19 Occasions, 20-39 Occasions, 40 or More)
Monitoring the Future Thirty-Day Prevalence for 12th Graders – Liquor By Race 31% decrease since 1977 36% decrease since 1977 SOURCE: The Monitoring the Future Study, the University of Michigan. http://www.monitoringthefuture.org/pubs/monographs/mtf-vol1_2010.pdf Table D-88 The sample sizes in 2010 are 15,769 eighth graders in 147 schools, 15,586 tenth graders in 123 schools, and 15,127 twelfth graders in 126 schools, for a total of 46,482 students in 396 secondary schools. The samples are drawn separately at each grade level to be representative of students in that grade in public and private secondary schools across the coterminous United States. To derive percentages for each racial subgroup, data for the specified year and the previous year have been combined to increase subgroup sample sizes and thus provide more stable estimates. Question: On how many occasions (if any) have you had liquor to drink during the last 30 days? (0 Occasions, 1-2 Occasions, 3-5 Occasions, 6-9 Occasions, 10-19 Occasions, 20-39 Occasions, 40 or More)
Monitoring the Future Thirty-Day Prevalence for 12th Graders – Beer By Race 43% decrease since 1977 51% decrease since 1977 39% decrease since 1977 SOURCE: The Monitoring the Future Study, the University of Michigan. http://www.monitoringthefuture.org/pubs/monographs/mtf-vol1_2010.pdf Table D-84 The sample sizes in 2010 are 15,769 eighth graders in 147 schools, 15,586 tenth graders in 123 schools, and 15,127 twelfth graders in 126 schools, for a total of 46,482 students in 396 secondary schools. The samples are drawn separately at each grade level to be representative of students in that grade in public and private secondary schools across the coterminous United States. To derive percentages for each racial subgroup, data for the specified year and the previous year have been combined to increase subgroup sample sizes and thus provide more stable estimates. Question: On how many occasions (if any) have you had beer to drink during the last 30 days? (0 Occasions, 1-2 Occasions, 3-5 Occasions, 6-9 Occasions, 10-19 Occasions, 20-39 Occasions, 40 or More)
Monitoring the Future Thirty-Day Prevalence for 12th Graders – Wine Coolers By Race 65% decrease since 1989 49% decrease since 1989 58% decrease since 1989 SOURCE: The Monitoring the Future Study, the University of Michigan. http://www.monitoringthefuture.org/pubs/monographs/mtf-vol1_2010.pdf Table D-94 The sample sizes in 2010 are 15,769 eighth graders in 147 schools, 15,586 tenth graders in 123 schools, and 15,127 twelfth graders in 126 schools, for a total of 46,482 students in 396 secondary schools. The samples are drawn separately at each grade level to be representative of students in that grade in public and private secondary schools across the coterminous United States. To derive percentages for each racial subgroup, data for the specified year and the previous year have been combined to increase subgroup sample sizes and thus provide more stable estimates. Question: On how many occasions (if any) have you had wine cooler(s) to drink during the last 30 days? (0 Occasions, 1-2 Occasions, 3-5 Occasions, 6-9 Occasions, 10-19 Occasions, 20-39 Occasions, 40 or More)
Monitoring the Future Thirty-Day Prevalence for 12th Graders – Wine By Race 68% decrease since 1977 79% decrease since 1977 78% decrease since 1977 SOURCE: The Monitoring the Future Study, the University of Michigan. http://www.monitoringthefuture.org/pubs/monographs/mtf-vol1_2010.pdf Table D-90 The sample sizes in 2010 are 15,769 eighth graders in 147 schools, 15,586 tenth graders in 123 schools, and 15,127 twelfth graders in 126 schools, for a total of 46,482 students in 396 secondary schools. The samples are drawn separately at each grade level to be representative of students in that grade in public and private secondary schools across the coterminous United States. To derive percentages for each racial subgroup, data for the specified year and the previous year have been combined to increase subgroup sample sizes and thus provide more stable estimates. Note: In the 1988 questionnaires, a question on the use of wine coolers was added. This change may account for the discontinuity between the 1987 and 1988 use rates for wine. Question: On how many occasions (if any) have you had wine to drink, not counting wine coolers during the last 30 days? (0 Occasions, 1-2 Occasions, 3-5 Occasions, 6-9 Occasions, 10-19 Occasions, 20-39 Occasions, 40 or More)
Monitoring the Future Two-Week Prevalence for 12th Graders 5+ Drinks in a Row – Beer By Race 35% decrease since 1977 68% decrease since 1977 40% decrease since 1977 SOURCE: The Monitoring the Future Study, the University of Michigan. http://www.monitoringthefuture.org/pubs/monographs/mtf-vol1_2010.pdf Table D-87 The sample sizes in 2010 are 15,769 eighth graders in 147 schools, 15,586 tenth graders in 123 schools, and 15,127 twelfth graders in 126 schools, for a total of 46,482 students in 396 secondary schools. The samples are drawn separately at each grade level to be representative of students in that grade in public and private secondary schools across the coterminous United States. To derive percentages for each racial subgroup, data for the specified year and the previous year have been combined to increase subgroup sample sizes and thus provide more stable estimates. Question: Think back over the last two weeks. How many times have you had five or more 12-ounce cans of beer (or the equivalent) in a row? (None, Once, Twice, 3 to 5 times, 6 to 9 times, 10 or more times)
Monitoring the Future Two-Week Prevalence for 12th Graders 5+ Drinks in a Row – Alcohol By Race 32% decrease since 1977 31% decrease since 1977 39% decrease since 1977 SOURCE: The Monitoring the Future Study, the University of Michigan. http://www.monitoringthefuture.org/pubs/monographs/mtf-vol1_2010.pdf Table D-81 The sample sizes in 2010 are 15,769 eighth graders in 147 schools, 15,586 tenth graders in 123 schools, and 15,127 twelfth graders in 126 schools, for a total of 46,482 students in 396 secondary schools. The samples are drawn separately at each grade level to be representative of students in that grade in public and private secondary schools across the coterminous United States. To derive percentages for each racial subgroup, data for the specified year and the previous year have been combined to increase subgroup sample sizes and thus provide more stable estimates. Question: Think back over the last two weeks. How many times have you had five or more drinks in a row? (None, Once, Twice, 3 to 5 times, 6 to 9 times, 10 or more times)
Monitoring the Future Two-Week Prevalence for 12th Graders 5+ Drinks in a Row – Liquor By Race 18% decrease since 1977 SOURCE: The Monitoring the Future Study, the University of Michigan. http://www.monitoringthefuture.org/pubs/monographs/mtf-vol1_2010.pdf Table D-89 The sample sizes in 2010 are 15,769 eighth graders in 147 schools, 15,586 tenth graders in 123 schools, and 15,127 twelfth graders in 126 schools, for a total of 46,482 students in 396 secondary schools. The samples are drawn separately at each grade level to be representative of students in that grade in public and private secondary schools across the coterminous United States. To derive percentages for each racial subgroup, data for the specified year and the previous year have been combined to increase subgroup sample sizes and thus provide more stable estimates. Question: Think back over the last two weeks. How many times have you had five or more mixed drinks or shot glasses of hard liquor in a row? (None, Once, Twice, 3 to 5 times, 6 to 9 times, 10 or more times)
Monitoring the Future Two-Week Prevalence for 12th Graders 5+ Drinks in a Row – Wine By Race 66% decrease since 1977 74% decrease since 1977 83% decrease since 1977 SOURCE: The Monitoring the Future Study, the University of Michigan. http://www.monitoringthefuture.org/pubs/monographs/mtf-vol1_2010.pdf Table D-91 The sample sizes in 2010 are 15,769 eighth graders in 147 schools, 15,586 tenth graders in 123 schools, and 15,127 twelfth graders in 126 schools, for a total of 46,482 students in 396 secondary schools. The samples are drawn separately at each grade level to be representative of students in that grade in public and private secondary schools across the coterminous United States. To derive percentages for each racial subgroup, data for the specified year and the previous year have been combined to increase subgroup sample sizes and thus provide more stable estimates. Question: Think back over the last two weeks. How many times have you had five or more 4-ounce glasses of wine in a row (or the equivalent, which is about three-fourths of a bottle)? (None, Once, Twice, 3 to 5 times, 6 to 9 times, 10 or more times)
Monitoring the Future Two-Week Prevalence for 12th Graders 5+ Drinks in a Row – Wine Coolers By Race 55% decrease since 1977 45% decrease since 1977 36% decrease since 1977 SOURCE: The Monitoring the Future Study, the University of Michigan. http://www.monitoringthefuture.org/pubs/monographs/mtf-vol1_2010.pdfTable D-95 The sample sizes in 2010 are 15,769 eighth graders in 147 schools, 15,586 tenth graders in 123 schools, and 15,127 twelfth graders in 126 schools, for a total of 46,482 students in 396 secondary schools. The samples are drawn separately at each grade level to be representative of students in that grade in public and private secondary schools across the coterminous United States. To derive percentages for each racial subgroup, data for the specified year and the previous year have been combined to increase subgroup sample sizes and thus provide more stable estimates. Question: Think back over the last two weeks. How many times have you had five or more 12-ounce bottles of wine cooler (or the equivalent) in a row? (None, Once, Twice, 3 to 5 times, 6 to 9 times, 10 or more times)