Download
1 / 1
10 likes | 135 Views
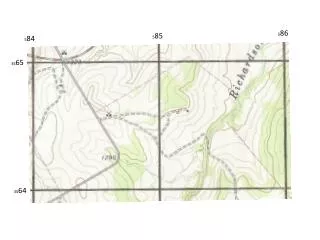
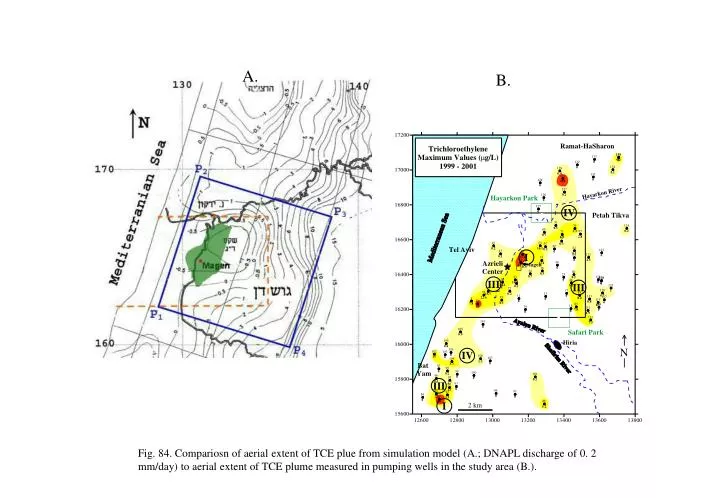
A. B. Fig. 84. Compariosn of aerial extent of TCE plue from simulation model (A.; DNAPL discharge of 0. 2 mm/day) to aerial extent of TCE plume measured in pumping wells in the study area (B.).

E N D
A. B. Fig. 84. Compariosn of aerial extent of TCE plue from simulation model (A.; DNAPL discharge of 0. 2 mm/day) to aerial extent of TCE plume measured in pumping wells in the study area (B.).