Download
1 / 33
430 likes | 862 Views
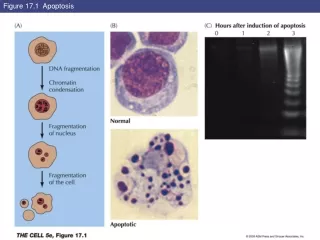
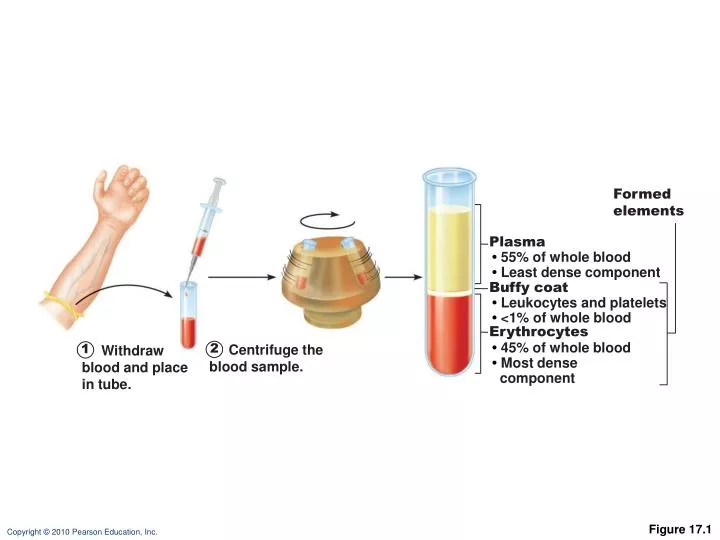
Formed elements. Plasma. • 55% of whole blood • Least dense component. Buffy coat. • Leukocytes and platelets • <1% of whole blood. Erythrocytes. 2. • 45% of whole blood • Most dense component. 1. Centrifuge the blood sample. Withdraw blood and place in tube.

E N D
Formed elements Plasma • 55% of whole blood • Least dense component Buffy coat • Leukocytes and platelets • <1% of whole blood Erythrocytes 2 • 45% of whole blood • Most dense component 1 Centrifuge the blood sample. Withdraw blood and place in tube. Figure 17.1
Platelets Erythrocytes Monocyte Neutrophils Lymphocyte Figure 17.2
2.5 µm Side view (cut) 7.5 µm Top view Figure 17.3
bGlobin chains Heme group a Globin chains (a) Hemoglobin consists of globin (two alpha and two beta polypeptide chains) and four heme groups. (b) Iron-containing heme pigment. Figure 17.4
Stem cell Committed cell Developmental pathway Phase 1 Ribosome synthesis Phase 2 Hemoglobin accumulation Phase 3 Ejection of nucleus Reticulo- cyte Erythro- cyte Proerythro- blast Early erythroblast Late erythroblast Normoblast Hemocytoblast Figure 17.5
IMBALANCE Homeostasis: Normal blood oxygen levels 1 Stimulus: Hypoxia (low blood O2- carrying ability) due to • DecreasedRBC count • Decreased amountof hemoglobin • Decreasedavailability of O2 5 O2- carryingability of bloodincreases. IMBALANCE 4 Enhancederythropoiesisincreases RBCcount. 2 Kidney (and liver toa smaller extent)releaseserythropoietin. 3 Erythropoietinstimulates redbone marrow. Figure 17.6
IMBALANCE Homeostasis: Normal blood oxygen levels 1 Stimulus: Hypoxia (low blood O2- carrying ability) due to • DecreasedRBC count • Decreased amountof hemoglobin • Decreasedavailability of O2 IMBALANCE Figure 17.6, step 1
IMBALANCE Homeostasis: Normal blood oxygen levels 1 Stimulus: Hypoxia (low blood O2- carrying ability) due to • DecreasedRBC count • Decreased amountof hemoglobin • Decreasedavailability of O2 IMBALANCE 2 Kidney (and liver toa smaller extent)releaseserythropoietin. Figure 17.6, step 2
IMBALANCE Homeostasis: Normal blood oxygen levels 1 Stimulus: Hypoxia (low blood O2- carrying ability) due to • DecreasedRBC count • Decreased amountof hemoglobin • Decreasedavailability of O2 IMBALANCE 2 Kidney (and liver toa smaller extent)releaseserythropoietin. 3 Erythropoietinstimulates redbone marrow. Figure 17.6, step 3
IMBALANCE Homeostasis: Normal blood oxygen levels 1 Stimulus: Hypoxia (low blood O2- carrying ability) due to • DecreasedRBC count • Decreased amountof hemoglobin • Decreasedavailability of O2 IMBALANCE 4 Enhancederythropoiesisincreases RBCcount. 2 Kidney (and liver toa smaller extent)releaseserythropoietin. 3 Erythropoietinstimulates redbone marrow. Figure 17.6, step 4
IMBALANCE Homeostasis: Normal blood oxygen levels 1 Stimulus: Hypoxia (low blood O2- carrying ability) due to • DecreasedRBC count • Decreased amountof hemoglobin • Decreasedavailability of O2 5 O2- carryingability of bloodincreases. IMBALANCE 4 Enhancederythropoiesisincreases RBCcount. 2 Kidney (and liver toa smaller extent)releaseserythropoietin. 3 Erythropoietinstimulates redbone marrow. Figure 17.6, step 5
1 Low O2levels in blood stimulate kidneys to produce erythropoietin. 2 Erythropoietin levels rise in blood. 3 Erythropoietin and necessary raw materials in blood promote erythropoiesis in red bone marrow. 4 New erythrocytes enter bloodstream; function about 120 days. 5 Aged and damaged red blood cells are engulfed by macrophages of liver, spleen, and bone marrow; the hemoglobin is broken down. Hemoglobin Heme Globin Bilirubin Amino acids Iron stored as ferritin, hemosiderin Iron is bound to transferrin and released to blood from liver as needed for erythropoiesis. Bilirubin is picked up from blood by liver, secreted into intestine in bile, metabolized to stercobilin by bacteria, and excreted in feces. Circulation Food nutrients, including amino acids, Fe, B12, and folic acid, are absorbed from intestine and enter blood. 6 Raw materials are made available in blood for erythrocyte synthesis. Figure 17.7
1 Low O2levels in blood stimulate kidneys to produce erythropoietin. Figure 17.7, step 1
1 Low O2levels in blood stimulate kidneys to produce erythropoietin. 2 Erythropoietin levels rise in blood. Figure 17.7, step 2
1 Low O2levels in blood stimulate kidneys to produce erythropoietin. 2 Erythropoietin levels rise in blood. 3 Erythropoietin and necessary raw materials in blood promote erythropoiesis in red bone marrow. Figure 17.7, step 3
1 Low O2levels in blood stimulate kidneys to produce erythropoietin. 2 Erythropoietin levels rise in blood. 3 Erythropoietin and necessary raw materials in blood promote erythropoiesis in red bone marrow. 4 New erythrocytes enter bloodstream; function about 120 days. Figure 17.7, step 4
Hemoglobin 5 Aged and damaged red blood cells are engulfed by macrophages of liver, spleen, and bone marrow; the hemoglobin is broken down. Heme Globin Bilirubin Amino acids Iron stored as ferritin, hemosiderin Bilirubin is picked up from blood by liver, secreted into intestine in bile, metabolized to stercobilin by bacteria, and excreted in feces. Circulation Figure 17.7, step 5
Hemoglobin 5 Aged and damaged red blood cells are engulfed by macrophages of liver, spleen, and bone marrow; the hemoglobin is broken down. Heme Globin Bilirubin Amino acids Iron stored as ferritin, hemosiderin Iron is bound to transferrin and released to blood from liver as needed for erythropoiesis. Bilirubin is picked up from blood by liver, secreted into intestine in bile, metabolized to stercobilin by bacteria, and excreted in feces. Circulation Food nutrients, including amino acids, Fe, B12, and folic acid, are absorbed from intestine and enter blood. 6 Raw materials are made available in blood for erythrocyte synthesis. Figure 17.7, step 6
1 Low O2levels in blood stimulate kidneys to produce erythropoietin. 2 Erythropoietin levels rise in blood. 3 Erythropoietin and necessary raw materials in blood promote erythropoiesis in red bone marrow. 4 New erythrocytes enter bloodstream; function about 120 days. 5 Aged and damaged red blood cells are engulfed by macrophages of liver, spleen, and bone marrow; the hemoglobin is broken down. Hemoglobin Heme Globin Bilirubin Amino acids Iron stored as ferritin, hemosiderin Iron is bound to transferrin and released to blood from liver as needed for erythropoiesis. Bilirubin is picked up from blood by liver, secreted into intestine in bile, metabolized to stercobilin by bacteria, and excreted in feces. Circulation Food nutrients, including amino acids, Fe, B12, and folic acid, are absorbed from intestine and enter blood. 6 Raw materials are made available in blood for erythrocyte synthesis. Figure 17.7
(a) Normal erythrocyte has normal hemoglobin amino acid sequence in the beta chain. 1 2 3 4 5 6 7 146 (b) Sickled erythrocyte results from a single amino acid change in the beta chain of hemoglobin. 1 2 3 4 5 6 7 146 Figure 17.8
Differential WBC count (All total 4800– 10,800/l) Formed elements Platelets Granulocytes Neutrophils (50–70%) Leukocytes Eosinophils (2–4%) Basophils (0.5–1%) Erythrocytes Agranulocytes Lymphocytes (25 – 45%) Monocytes (3 – 8%) Figure 17.9
Stem cells Hemocytoblast Lymphoid stem cell Myeloid stem cell Committed cells Myeloblast Myeloblast Myeloblast Monoblast Lymphoblast Developmental pathway Promonocyte Promyelocyte Promyelocyte Promyelocyte Prolymphocyte Eosinophilic myelocyte Basophilic myelocyte Neutrophilic myelocyte Basophilic band cells Eosinophilic band cells Neutrophilic band cells Monocytes Neutrophils Eosinophils Basophils Lymphocytes (a) (e) (b) (c) (d) Agranular leukocytes Some become Granular leukocytes Some become Figure 17.11
Stem cell Developmental pathway Hemocyto- blast Promegakaryocyte Megakaryoblast Megakaryocyte Platelets Figure 17.12
1 Step Vascular spasm •Smooth muscle contracts, causing vasoconstriction. 2 Step Platelet plug formation •Injury to lining of vessel exposes collagen fibers; platelets adhere. Collagen fibers •Platelets release chemicals that make nearby platelets sticky; platelet plug forms. Platelets 3 Step Coagulation •Fibrin forms a mesh that traps red blood cells and platelets, forming the clot. Fibrin Figure 17.13
Phase 1 Intrinsic pathway Extrinsic pathway Tissue cell trauma exposes blood to Vessel endothelium ruptures, exposing underlying tissues (e.g., collagen) Platelets cling and their surfaces provide sites for mobilization of factors Tissue factor (TF) XII Ca2+ XIIa VII XI XIa VIIa Ca2+ IX IXa PF3 released by aggregated platelets VIII VIIIa TF/VIIacomplex IXa/VIIIacomplex X Xa Ca2+ V PF3 Va Prothrombin activator Figure 17.14 (1 of 2)
Prothrombin activator Phase 2 Prothrombin (II) Thrombin (IIa) Phase 3 Fibrinogen (I) (soluble) Ca2+ Fibrin (insoluble polymer) XIII XIIIa Cross-linked fibrin mesh Figure 17.14 (2 of 2)
Serum Blood being tested Anti-A Anti-B Type AB (contains agglutinogens A and B; agglutinates with both sera) RBCs Type A (contains agglutinogen A; agglutinates with anti-A) Type B (contains agglutinogen B; agglutinates with anti-B) Type O(contains no agglutinogens; does not agglutinate with either serum) Figure 17.16