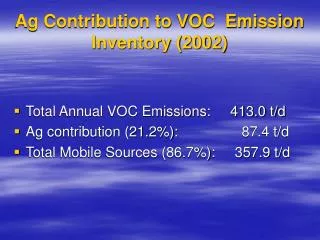
Download
1 / 20
200 likes | 203 Views
This presentation describes the contribution made by different VOC emission sources to photochemical ozone formation in Europe. It compares the incremental reactivities and contributions to ozone formation of 248 VOC emission source categories using the UK Photochemical Trajectory Model. The findings suggest that targeting the most reactive source categories in VOC control strategies could be more cost-effective than current estimates.

E N D
CONTRIBUTION FROM DIFFERENT VOC EMISSION SOURCES TO PHOTOCHEMICAL OZONE FORMATION IN EUROPE Dick Derwent rdscientific This work was supported by the UK Department for Environment Food and Rural Affairs under contract number EPG 1/3/200
AIM OF THE PRESENTATION To describe the contribution made by the different VOC emission sources to photochemical ozone formation over Europe.
UK PHOTOCHEMICAL TRAJECTORY MODEL Model description A single air parcel following a trajectory across Europe Emissions of SO2, NOx, VOCs, CH4, CO and isoprene From EMEP and UK NAEI inventories Master Chemical Mechanism
MASTER CHEMICAL MECHANISM • 137 emitted organic compounds • 4,414 reaction products • 12,871 chemical reactions Detailed explicit chemical mechanism to represent the contribution made by each individual VOC species. Developed by Michael Jenkin of Imperial College and Michael Pilling of University of Leeds and available at: http://mcm.leeds.ac.uk/MCM
MASTER CHEMICAL MECHANISM Generates the same picture of regional ozone formation across Europe as other mechanisms Used here because it is the only mechanism that treats each emitted VOC species in explicit detail VOC source categories can only be treated explicitly with a chemical mechanism that treats each species in detail
VOC SPECIATION UK NAEI 248 emission source categories at the SNAP 3 level each has its own profile containing 667 VOC species 248 x 667 matrix UK Photochemical Trajectory Model 248 x 177 matrix of category x species 90% coverage of total VOC mass emissions fractional speciation held constant across Europe
EXPERIMENTAL DESIGN Base Case Experiment Run with year 2000 VOC, NOx, SO2, CO, isoprene and CH4 emissions and year 2000 VOC fractional speciation Ozone at arrival point 87.8 ppb 248 sensitivity cases Run with the emissions from each VOC emission source category increased fractionally Determine by difference the extra ozone formed
SENSITIVITY EXPERIMENTS An additional emission was added in turn from each VOC emission source category across Europe. The extra emission amounted to a 7.3% increase in VOC emissions. The speciation of the extra emission was given the same species profile as the emission source category. The increase in emission was applied everywhere across Europe
INCREMENTAL REACTIVITYOF A VOC EMISSION SOURCE CATEGORY This is the increase in ozone in ppb divided by the fractional increase in the emissions from that source category: O3 ---------------------------- VOC --------- VOC Incremental reactivities depend on the environmental conditions and are not geophysical quantities
CONTRIBUTION TO OZONE FORMATION Ozone formation = Incremental Reactivity x Fractional contribution to total VOC emissions
CONTRIBUTION TO OZONE FORMATION % incremental ozone emissions reactivity ppb
CONTRIBUTION TO OZONE FORMATION Each source category has a different incremental reactivity because of the contribution from the different VOCs that make up its species profile. Each source category makes a different contribution to ozone formation because of its different incremental reactivity and its different contribution to total emissions.
DOES IT MAKE ANY DIFFERENCE IF THE INFORMATION ABOUT THE INCREMENTAL REACTIVITIES IS USED IN CONTROL STRATEGIES ? Base case 87.8 ppb 4 ppb Based on incremental reactivities for 248 source categories
DOES IT STILL MAKE A DIFFERENCE AT THE HIGHLY AGGREGATED SNAP 1 LEVEL ? 1.9 ppb Road transport solvents Based on incremental reactivities of 11 SNAP 1 source categories Extraction & distribution of fossil fuels
CONCLUSIONS Incremental reactivities have been constructed for 248 VOC emission source categories. There is a factor of over 30 range in these incremental reactivities which is not represented in the EMEP/RAINS models. These variations in reactivity are caused by the different VOC species profiles for each source category. VOC control strategies targetting the most reactive source categories could be more cost-effective than currently estimated using the EMEP/RAINS models.