Download
1 / 70
710 likes | 860 Views
An Evolution of Environmental Prevention Models. Bob Saltz Richard McGaffigan Prevention Research Center Berkeley, California. Pacific Institute for Research and Evaluation. Prevention Research Center. Presentation Objectives. Planning phase discussion Needs assessment Baseline data

E N D
An Evolution of Environmental Prevention Models Bob Saltz Richard McGaffigan Prevention Research CenterBerkeley, California Pacific Institute for Researchand Evaluation Prevention Research Center
Presentation Objectives • Planning phase discussion • Needs assessment • Baseline data • Strategic partners • Resource assessment • Model programs vs evidence-based strategies • Evaluation strategy
Presentation Objectives • Outline an evolution of prevention models by: • Describing the Community Trials project • The Border Project • Safer California Universities project
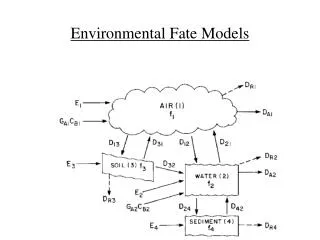
COMMUNITY TRIALS TO PREVENT ALCOHOL-INVOLVED TRAUMA 1991-1997 Prevention Research Center Berkeley, CA Sponsors: National Institute on Alcohol Abuse and Alcoholism & Center for Substance Abuse Prevention
Up to 50% of fatal car crashes involve alcohol. More than 20,000 people are killed and 650,000 are injured annually.
Goal: Reduce Alcohol-involved Trauma Traffic Crashes Injuries -- burns -- falls Drownings Violence
- Modesto Modesto . . Salinas Salinas . . Orange Orange . Florence Florence . Oceanside Oceanside Sumter Sumter Experimental Experimental Comparison Comparison National Community Trial to Prevent Alcohol-involved Trauma
Five Prevention Components 1. Community Mobilization 2. Responsible Beverage Service 3. Risk of Drinking and Driving 4. Underage Drinking 5. Alcohol Access
Alcohol-involved Trauma at the Community Level: Conceptual Model MOBILIZATION DRINKING AND DRIVING Local News about AlcoholProblems & Enforcement Perceived Risk of Arrest Local Law Enforcement RESPONSIBLE BEVERAGE SERVICE Driving after Drinking Social Access to Alcohol Alcohol Serving and Sales Practices UNDERAGE DRINKING Retail Alcohol Availability (On and Off-premise) Local Regulation of Alcohol (Density, Hours of Sale) Alcohol-involved Injury and Death (Traffic and Other) Alcohol Intoxication or Impairment ALCOHOL ACCESS Non-Traffic Risk Activities
Community Trials Final Results Heavy Drinking (-6%) Driving after “Too much to drink” (- 49%) BAC Positive Drivers (- 44%) Nighttime Injury Crashes (-10%) Assaults -- Hospital Cases (-2%) -- Emergency Room Cases (- 43%)
The San Diego-Tijuana Project to Reduce Teen and Binge Drinking Institute for Public Strategies www.publicstrategies.org
Community Mobilization Recruitment Learning Strategy Selection Data Collection & Evaluation Strategy Implementation System functional model for community prevention
Pacific Institute Data collection Data feedback to programming Program design Policy support Media hook Institute for Public strategies Design and implement prevention strategy Policy Community organizing Media Law enforcement Research / Practice Partnership
1. San Diego County Telephone Survey 2. 4. South- bound border survey North- bound border survey 3. Tijuana bars Border field laboratory
The Problem • Underage and binge drinking in Mexico • Thousands of US teenagers cross into Tijuana on a weekend evening • Alcohol related problems are the result • DUI Crashes • Fights, injuries, crime and arrests • Exposure to STD’s • Poor school performance
Strategic Change Model Policy Community Organizing Effective Advocacy Campaign Enforcement Scientific Data & Research Media Advocacy
USA Mexico Border ProjectMultiple Interventions Binational Collaboration • Northbound • Community • Policing • DUI • checkpoint • Southbound • Operation Safe Crossing • Tijuana • RBS training • ID training • Ban Alcohol Ads • Enforcement in Tijuana Bars
Safer California Colleges and Universities:A risk management approach to college student drinking problems
Mean Score for 5+ Drinks in a Row in Past 2 Weeks by 4-year College Student Status Twice Once College Non-College None Wave 1 Wave 2 Wave 3 Wave 4 (18) (19-20) (21-22) (23-24) Measurement Wave
Injury 500,000 students between the ages of 18 and 24 are unintentionally injured under the influence of alcohol (Hingson et al., 2002)
Assault More than 600,000 students between the ages of 18 and 24 are assaulted by another student who has been drinking (Hingson et al., 2002)
Sexual Abuse More than 70,000 students between the ages of 18 and 24 are victims of alcohol-related sexual assault or date rape (Hingson et al., 2002)
Drunk Driving 2.1 million students between the ages of 18 and 24 drove under the influence of alcohol last year (Hingson et al., 2002)
Academic Problems About 25 percent of college students report academic consequences of their drinking including missing class, falling behind, doing poorly on exams or papers, and receiving lower grades overall (Engs et al., 1996; Presley et al., 1996a, 1996b; Wechsler et al., 2002)
What are we trying to prevent? • Intoxication • Harm related to intoxication
Safer California UniversitiesProject Goal To evaluate the efficacy of a“Risk Management” approach to alcohol problem prevention
Risk Management • Risk Assessment • Risk Reduction • Risk Monitoring
Risk Assessment • Brief interviews with key personnel • Archival data sources • Student survey data
Risk Reduction Matching intervention to risky settings: • Fraternity parties • Drinking in residence halls • Drinking associated with athletic events • Drinking at off-campus bars & restaurants
Risk Monitoring • Key role of archival data • Iterative process of evaluation…. • …with improved implementation
How is risk management a unique approach? • Targets times and places instead of individuals • Focus on intoxication • Tied to continuous monitoring and improvement - emphasis on “control” rather than “one shot” interventions
Anticipated Hurdles for Prevention Strategy • Implicit assumption that “target” is high-risk drinkers
Anticipated Hurdles for Prevention Strategy • Implicit assumption that “target” is high-risk drinkers • Ambivalence about student drinking • Low perceived efficacy of environmental interventions • Challenges of coordination and resource allocation • Possible fears of “backlash”
Hypothesized Elements Necessary for Purposive Environmental Interventions • Organizational Knowledge of Problem • Clear Focus • Organizational Efficacy • Resources • Coordination • Commitment • Perceived Efficacy • Continuous Feedback/Evaluation
For copies of: • The full report (readable on-line): National Academies Press www.nap.edu Order by phone: 888-624-7645 • FACE’s executive summary publication: www.faceproject.org
Task Force Recommendations • Tier 1:Evidence of Effectiveness Among College Students • Tier 2:Evidence of Success With General Populations That Could Be Applied to College Environments • Tier 3:Evidence of Logical and Theoretical Promise, But Require More Comprehensive Evaluation • Tier 4:Evidence of Ineffectiveness
Supplemental Slides These slides were not presented, but are included in case anyone might be interested in seeing a bit more on related topics
Access: Sources of Alcohol Used by Underage Drinkers, Past 30 Days Source: Harrison, et al., 2000
Access: Commercial Availability • Strengthen compliance check programs. • The federal government should require states to achieve designated rates of retailer compliance. • All sellers and servers of alcohol complete state-approved training as a condition of employment.
Effects of Compliance Checks and RBS on Underage Sales Source: Grube, 1997
Access: Social Availability • Implement enforcement programs to deter adults from purchasing alcohol for minors. • Establish and implement a system requiring registration of beer kegs. • Adopt and publicize policies for detecting and terminating underage drinking parties.