Download
1 / 14

E N D
Context Diagrams • IPT 2010
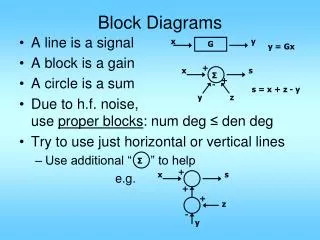
Context Diagrams • Context diagrams are used to represent entire information systems. The system is shown as a single process along with the inputs and outputs (external entities) to the system. The external entities are connected to the single process by data flow arrows.
Context Diagrams • A context diagram is often the starting point of a data flow diagram. Context diagrams show the flow of data in a system.
3 Symbols • The Process • The Data Flow • The External Entity
Process Single Process: A circle is used to represent the entire system.
Data Flow Data Flow: An arrow is used to represent the flow of data between the process and external entities.
External Entity External Entity: A square or rectangle represents any person or organisation that sends data to or receives data from the system.
ExampleFinding a book in the library Search Book Details Borrower Call Number Borrower
ExampleA context diagram for a retail sales company company. Head Office Office Banking Sales Dept. Suppliers Sales Division Division Warehouses Accounts Purchase Dept.
Activity • A marking system is a process used to determine the result of an assessment task. Students complete the assessment task and receive a mark from the marking system. A teacher constructs a marking scale for the assessment task and receives each student’s mark. Construct a context diagram for the marking system.
Textbook • Page 270- ‘Consider the Following” • ~Read as a whole class~
HSC Style Question • Development of a new information system is being considered. They system is used to assess the impact of various types of security used to protect different types of residential and commercial buildings in various locations. The system aims to provide information to insurance companies to enable them to accurately modify the amount their customers pay for insurance based on the insured building’s security features, location and type. The results from the system will be sold to insurance companies who can then download updated information each month. • a) Draw a context diagram for the proposed system based on the above description
Suggested Solution Security Assessment System Assessment Building owners and tenants Insurance Companies Building Type, Location, Security Features Results How did you go??
Textbook Reading • Read pg. 395-396. • Group Task Discussions pg.396 • Group Task Activity pg.36