Download
1 / 38
380 likes | 487 Views
#25-1 February 14, 2011.

E N D
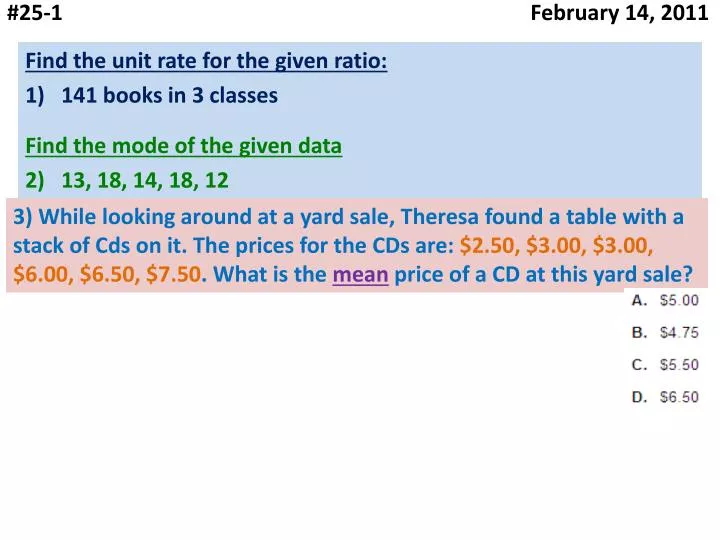
#25-1 February 14, 2011 3) While looking around at a yard sale, Theresa found a table with a stack of Cds on it. The prices for the CDs are: $2.50, $3.00, $3.00, $6.00, $6.50, $7.50. What is the mean price of a CD at this yard sale? Find the unit rate for the given ratio: 141 books in 3 classes Find the mode of the given data 2) 13, 18, 14, 18, 12
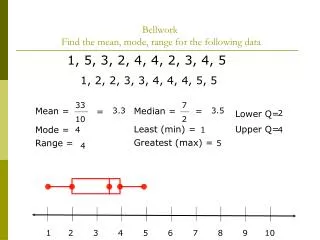
Feb. 14, 2011 Would using the MEAN be a good representation of the data? Mean: 14.6 Mean: 14.6 Mean: 14.6 We ________ use the mean because ________________ _______________________ _______________________ _______________________. We ________ use the mean because ________________ _______________________. We ________ use the mean because ________________ _______________________ _______________________ _______________________.
Feb. 14, 2011 A ______________________ is a measure that represents the ______ of a data set. Examples of measures of central tendency: _____ _____ _____
Feb. 14, 2011 The Median The ______is the _____________ in an ordered set of data. Step 1: List the numbers from ______ to _______. Step 2 Identify the _____________ in the list.
Feb. 14, 2011 What is the median? Order from least to greatest Find the middle number
What is the median? Feb. 14, 2011
Feb. 14, 2011 Median Practice
Feb. 14, 2011 The _____ is the number found by_______ a set of numbers and __________ the sum by the number of addends. The ________ is the ________ number in an ordered set of data. Step 1 List the numbers from ______ to ________. Step 2 Identify the _______ number in the list.
Feb. 14, 2011 Monday Homework Find the median of each data set
Feb. 14, 2011 Monday Homework Circle the outlier for each data set. Find the MEAN for each data set with and without the outlier. Explain what effect the outlier had on the MEAN. Mean:_____ Mean without outlier: _____ Explain the change to the MEAN when you took out the outlier. _________________________________________________________ Mean:_____ Mean without outlier: _____ Explain the change to the MEAN when you took out the outlier. _________________________________________________________
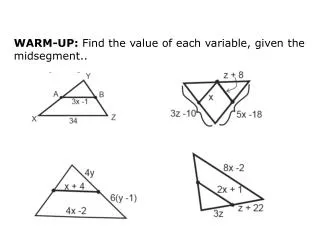
#25-2 February 15, 2011 3) A football team has linemen whose weights, in pounds, are: 295, 280, 290, 310, 335, 300, 345, 345 What is themedianweight of the linemen? Are these rates equivalent? Find the percent of the given number 2) 8.3% of 75
Feb. 15, 2011 FIND THE MODE ♠ find which number is written the most (occurs most often) OR ♠ find the number that has the most X on the line plot (you may have more than one answer)
Feb. 15, 2011 Find the MODE • 4, 6, 6, 5, 4, 8, 9, 6 ♠ find which number is written the most THE MODE OF THIS SET OF NUMBERS IS __ • How did you find your answer? • _______________________________________ • _______________________________________
Feb. 15, 2011 LET’S DO ANOTHER ONE • 11, 19, 8, 11, 15, 8, 9 ♠ find which number is written the most THE MODE OF THIS SET OF NUMBERS IS ______ • How did you find your answer? • _______________________________________ • _______________________________________
Feb. 15, 2011 Mode Practice Circle the mode
Feb. 15, 2011 Mode Practice • 17, 17, 13, 14, 12, 11, 17 mode:__________ • 20, 17, 15, 20, 18 mode:__________ • 3, 2, 2, 2, 0, 6, 1 mode:__________ • 5, 5, 7, 3, 2, 1 mode:__________ The _______ is the number that occurs __________.
Feb. 15, 2011 Tuesday Homework Find the mode of each data set
Tuesday Homework Feb. 15, 2011 Circle the mode of each chart Can you find the mean and the median of the shirt color and talent show tables? Explain. ______________________________________ ______________________________________ What is the MEDIAN age of the Little League players? (HINT: age 10 shows 3 so you would write: 10, 10, 10). ______________________ ______________________ IF I replaced a black shirt with a pink shirt, would that change the mode? Explain. ______________________________________ ______________________________________
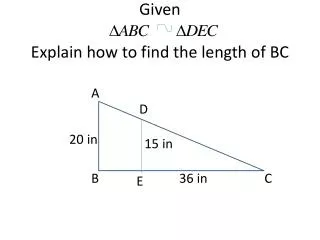
#25-3 February 16, 2011 3) The table below lists the top running speed, in miles per hour, for several animals. What is the median speed listed? Find the UNIT RATE A cyclist travels 109km in 4 hours Find the mean of the given data 121, 118, 127, 121, 123, 126, 125, 124
Feb. 16, 2011 FIND THE RANGE ♠ find the __________number and the __________ number ♠ __________ Range indicates how spread out the data is in a given data set.
Feb. 16, 2011 Range Examples Largest Number: _____ Smallest Number: _____ Range (difference): _____ Largest Number: _____ Smallest Number: _____ Range (difference): _____
Feb. 16, 2011 Range Examples • 4, 6, 6, 5, 4, 8, 9 ♠ find the __________ number and the __________ number ♠ __________ THE RANGE IS: _____ How did you find your answer? _________________
Feb. 16, 2011 Range Examples • 11, 19, 8, 11, 15, 8 ♠ find the __________ number and the __________ number ♠ __________ THE RANGE IS: _____ How did you find your answer? _________________
Feb. 16, 2011 Range Practice • 17, 17, 13, 14, 12, 11 __________ • 20, 17, 15, 20, 18 __________ • 3, 2, 2, 2, 0, 6, 1, 0 __________ • 5, 5, 8, 7, 3, 2, 1, 1 __________
Feb. 16, 2011 Range Practice Find the range with the 30-year old. ______________ Find the range when the 30-year-old is replaced by the 15-year-old. _______________ How was the RANGE effected by the change? _____________________________________________ _____________________________________________ _____________________________________________
Wednesday Homework Feb. 16, 2011 Range: _______________ Range: _______________ Show how to correctly find the median. _________________________________ _________________________________ Error in finding the median. ____________________________ ____________________________ Show how to correctly find the range. _________________________________ _________________________________ Error in finding the range. ____________________________ ____________________________
Wednesday Homework Feb. 16, 2011 With the lowest score Mean: ____ Median: _____ Mode: _____ Range: _____ WithOUT the lowest score Mean: ____ Median: _____ Mode: _____ Range: _____ Explain the affect to the mean: ____________________________________ Explain the affect to the median: ____________________________________ Explain the affect to the mode: ____________________________________ Explain the affect to the range: ____________________________________
#25-4 February 17, 2011 3) The heights of the students in a 6th grade chess club are shown in the stem-and-leaf plot below. What is the mode height? Which is the better buy? 9 ounces of sliced turkey for $4.99/lb 13 ounces of sliced turkey for $6.69/lb What is the range of the data? 2) 69, 71, 71, 100, 85, 93, 61
Feb. 17, 2011 Each person must role 20 times. You will have different data! Include: scale, scale label, data groups, label for data groups, title Mean: _____ (total ÷ 20) Median: _____ (list out each roll and circle the 10th and 11th numbers) Mode: _____ Range: _____
Make your bar graph here for YOUR data! Feb. 17, 2011 Compare your mean, median, mode, range and graph with your partner. What differences do you see? ____________________________________ ____________________________________ ____________________________________ ____________________________________ Explain why you have these differences. ____________________________________ ____________________________________ ____________________________________ ____________________________________
Thursday Homework Paper airplane contest
Thursday Homework Paper airplane contest __________________________ __________________________
#25-5 February 18, 2011 3) A patrolman is tracking the speeds of cars on the interstate one afternoon. The bar graph below show the speeds of some of the cars. What is the range of the car speeds? Which truck has the better fuel economy Truck A: 393 miles on 25 gallons fuel Truck B: 309 miles on 20 gallons fuel Which one is GREATER? 2) 1.267 _____ 12.67%
Feb. 18, 2011 • Mean: ____ • Median: _____ • Mode: _____ • Range: _____ • Which measurement best represents • the data? Explain (Be very specific. Give reasons • why the other measurements are not a good measure • of the data.) • _________________________________________________ • _________________________________________________ • _________________________________________________ • _________________________________________________ • _________________________________________________
Remove the OUTLIER and recalculate your mean, median, and mode. Feb. 18, 2011 • Mean: ____ • Median: _____ • Mode: _____ • Which measurement was most • affected by removing the outlier? • Explain (Be very specific. Give details of each change!) • _________________________________________________ • _________________________________________________ • _________________________________________________ • _________________________________________________ • _________________________________________________
Feb. 18, 2011 1). Find the mean for the FOUR seasons.__________ 2). Compare that number to the goal of 400. (higher or lower) 3). Determine which 2 answers choices can be eliminated. ___ and ___ 4). Check which answer choice that is remaining is accurate. Show ALL WORK to justify your answer choice!
Feb. 18, 2011 ___ ÷ 7 = 5 mi/day How many miles have you ridden? _____ How many more do you need? ________
Feb. 18, 2011 • Mean: ____ • Median: _____ • Mode: _____ • Mean: ____ • Median: _____ • Mode: _____ • Which measurement best • represents the data? • Explain (Be very specific. Give • reasons why the other measurements • are not a good measure of the data.) • ________________________________ • ________________________________ • ________________________________ • ________________________________ • ________________________________ • Which measurement best • represents the data? • Explain (Be very specific. Give • reasons why the other measurements • are not a good measure of the data.) • ________________________________ • ________________________________ • ________________________________ • ________________________________ • ________________________________