Download

1 / 12
120 likes | 192 Views
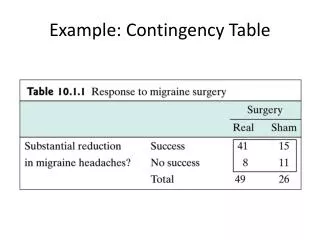
Understanding the table Example 1. Question: What is the quality (c.v) of the estimates for the proportion of girls aged 3 in Newfoundland and Labrador at cycle 3? How many will there be in cycle 4 and 5? Will the quality suffer from the smaller sample size?. Click on the right arrow in

E N D
Understanding the tableExample 1 Question: What is the quality (c.v) of the estimates for the proportion of girls aged 3 in Newfoundland and Labrador at cycle 3? How many will there be in cycle 4 and 5? Will the quality suffer from the smaller sample size?
Click on the right arrow in Province to select a province
Select Newfoundland and Labrador (Terre-Neuve)
Since the proportion of girls should be around 50%, click on Prop. Cible and select 50%.
You can now see that the c.v. for that particular domain in cycle 3 was 17.5% with 44 children in the sample. In cycle 5, we predict 35 children will be left in sample (assuming 90% response rate in cycle 4 and 5) and the c.v. will grow to 19.6%.
Understanding the tableExample 2 Question: What domains based on a 15% proportion are not publishable? We are looking for domains with a c.v. higher than 33.33%
Finally, type in 33.33 in the second field and click OK
You can now see the first few rows of estimates that we can’t release according to Statistics Canada generally used quality standards.