Download

1 / 13
140 likes | 251 Views
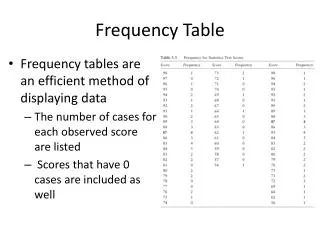
Frequency Table Example. Problem 24 page 46. Put the disk from the book in and find the Excel files and scroll down to Trough. You get this. Click on Data on the main menu and scroll to PivotTable and PivotChart Report to have this pop up. Have these two checked and hit next.

E N D
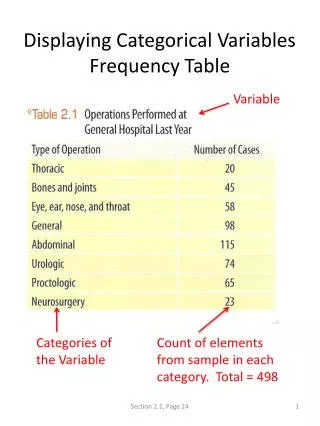
Frequency Table Example Problem 24 page 46
Put the disk from the book in and find the Excel files and scroll down to Trough. You get this
Click on Data on the main menu and scroll to PivotTable and PivotChart Report to have this pop up Have these two checked and hit next
This will pop up and make sure you put A1 to A50 because this is all the data including the label. If you want you can click on this button and then go and highlight all the data. Click it again to come back to here and then click next.
Touch and drag the box with the label Width (this was the name of the variable you included in the data) into the “Row” area. Do this again but go into the data area.
Note it says Sum of Width – this is the default – we will change later. Now click on OK.
You can go to a new worksheet – I like to stay at the existing one (so I click it and put in a cell number where I know the table will fit). Then click finish.
This is our initial result. Not very useful yet. But we will modify. Go to the “Sum of Width” cell and double click on it.
Change from Sum to Count – Count will give the Frequency of each value or group. Click on OK.
This pop up tells you the highest or maximum value is 8.498 and the lowest is 8.312 for a range of 0.186. Six classes means divide the 0.186 by 6 to get .031. So this would mean we could make each class width .03. Change the By to .03 and click OK.