Download
1 / 9
90 likes | 282 Views
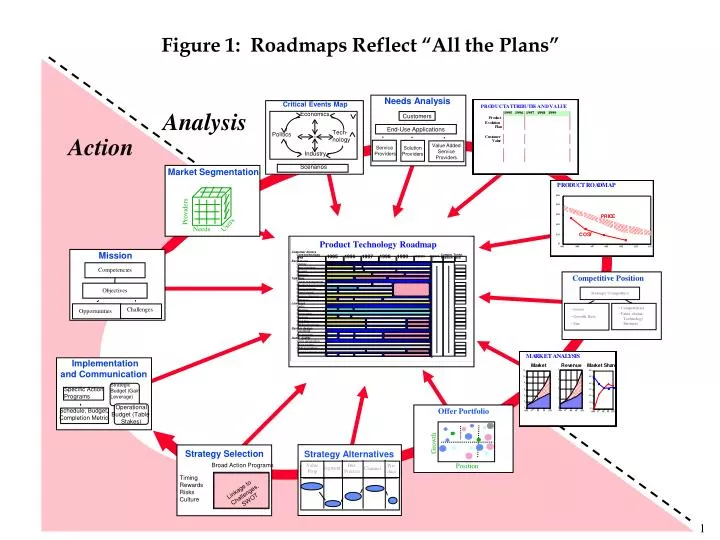
Needs Analysis. Critical Events Map. Economics. Customers. End-Use Applications. Tech- nology. Politics. Service Providers. Solution Providers. Value Added Service Providers. Industry. Scenarios. Market Segmentation. Providers. Users. Needs. Product Technology Roadmap.

E N D
Needs Analysis Critical Events Map Economics Customers End-Use Applications Tech- nology Politics Service Providers Solution Providers Value Added Service Providers Industry Scenarios Market Segmentation Providers Users Needs Product Technology Roadmap Mission Customer drivers Core technology Compet. Techn. 1995 1996 1997 1998 1999 Import. VISION Area Position M/B Ease of use Display User interface Competencies Keypad Software Competitive Position Talk time Power management Baseband processing Objectives Microcontroller Strategic Competitors Mixed signal Memory devices Batteries Low cost Radio Challenges • Sector • Growth Rate • Size • Competencies • Value chains: • Technology • Business Opportunities Antenna Power amp Housing Shielding PWB technology System design Standards Accessories Audio quality Voice recognition Voice coders DSP algorithms Transducers/microph. Implementation and Communication Strategic Budget (Gain Leverage) Specific Action Programs Operational Budget (Table Stakes) Offer Portfolio Schedule, Budget, Completion Metric Growth Strategy Selection Strategy Alternatives Broad Action Programs Position Value Prop Bus. Practice Pro- duct Segment Channel Timing Rewards Risks Culture Linkages to Challenges, SWOT Linkage to Challenges, SWOT Figure 1: Roadmaps Reflect “All the Plans” Analysis Action
Figure 2: Hypothetical Wireless Terminal High LevelProduct Hardware Roadmap Customer drivers VISION Import. Compet. Position Techn. M/B Core technology Area 1997 1998 1999 2000 2001 Ease of use Display CF B B F User interface C B Keypad CF B C F Software Talk time CF B Power management C F M Baseband processing CF M Microcontroller CF B Mixed signal B Memory devices CF CF B Batteries Low cost M CF Radio M Antenna CF B Power amp CF Housing B CF B Shielding B PWB technology CF System design M Standards CF B Accessories CF Audio quality M C F Voice recognition B CF Voice coders L M H - 0 + C = Current F = Future Funded Illustrative Data Decision Required Unfunded
Figure 3: Hypothetical System Platform High Level Product Software Roadmap Core technology area Tech M/S/T 1997 1998 1999 2000 2001 Competitive Position VISION Importance Device Drivers Equipment Manufacturer Specific SUPPORT OPEN SYSTEMS CF S S Transport Protocols Open Systems Interface CF Configuration Management M CF ? Compilation/ Loading Code EVOLVE TO SELF DOCUMENTING SELF MONITORING AUTOMATICALLY GENERATED HIGH RELIABIILITY VISUAL SOFTWARE Design CF M Automated Testing Manual Execution Automated CF S Product/Platform Languages Visual - GP C/C++ CF S Design Methods Formal Specifications Object Oriented C F M/T Formal Program Verification Niche Sized to Offer F C M/T Reliability Engineering Modeled Fail - Safe M CF Manual Documentation Automated S/T C F M/T Platform Customized Jury Rigged Prototyping (Rapid) Application CF SOFTWARE EVOLUTION PLAN L M H - 0 + C = Current (‘97 - ‘98) F = Future (‘99+) M =MAKE S=SOURCE T=TEAM Preserve the current software reliability competency/advantage. Leverage off-the-shelf SDE tools. Expand reuse-code libraries and include other assets (designs, specifications, etc.) Evolve from manual tracking of productivity measures, transitioning to industry benchmarked. Funded Unfunded Illustrative Data Decision Required
Figure 4: Sample Four Axes Scenario Space ADVANCED SCENARIO 1 INTEGRATED TECHNOLOGY FIELD / ADVANCED ENVIRONMENT SCENARIO 3 STRATIFIED TECHNOLOGY FIELD / ADVANCED ENVIRONMENT STRATIFIED INTEGRATED SCENARIO 4 STRATIFIED TECHNOLOGY FIELD / EMERGING ENVIRONMENT SCENARIO 2 INTEGRATED TECHNOLOGY FIELD / EMERGING ENVIRONMENT EMERGING
Figure 5: Scenario Planning Matrix Possible Evolution of Focal Point Over Planning Horizon High Short Narratives Observation One Observation Two Observation Three Observation Four Area/Driver Economic Political Impact on Strategy (Sequence as Appropriate) Social Technology Low
New Fields E Core Region Core Region A A A B Black Holes C Recognized Periphery Unrecognized Periphery D Figure 6. Recognizing the “Blind Spots”
7. Environ. Monitoring (BU) 12. Technology Alliance Mgt 18. Intellect. Property Mgt 10. Product Line Plan (BU) 3. Technology Strategy (Corp) 2. Business Strategy (Corp) 9. Technology Strategy (BU) 26. Technology Adoption 8. Business Strategy (BU) 23. Technology Needs Assessment 14. R&D Portfolio Management 6. Technology Strategy (R&D) 21. Initial Project Selection Figure 8: Technology Roadmapping 11. Technology Roadmapping (BU)
Figure 9: Non-Linear Roadmap Heuristic IDENTIFY CORPORATE AND ENVIRONMENTAL DRIVERS IDENTIFY RELEVANT PROCESSES SPECIFY UNDERLYING ASSUMPTIONS, STRESS POINTS, OPPORTUNITY POINTS AND FLAGS ASSESS IMPACT OF CHANGE ITERATE DEFINE ISSUE FOR COMPOSITE APPROACH DEVELOP PRELIMINARY ROADMAP, IDENTIFY CHANGE IMPACT ITERATE DEVELOP SCENARIO, IDENTIFY INDICATORS REFINE ROADMAP SPECIFY FORKS, FLEXPOINTS DEVELOP CENTRAL STRATEGY WITH VARIATIONS CREATE NON-LINEAR ROADMAP