Download
1 / 10
100 likes | 264 Views
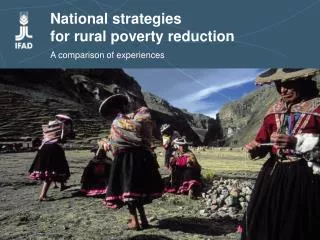
Data Provision for Poverty Reduction: Indonesia Experiences. Wynandin Imawan wynandin @bps.go.id BPS- Statistics Indonesia. Poverty Incidence: INDONESIA 1976 - 2008. *. * 1999 methods to calculate poverty incidents. Head Count Ratio : inter-provincial trend 200 7-2008.

E N D
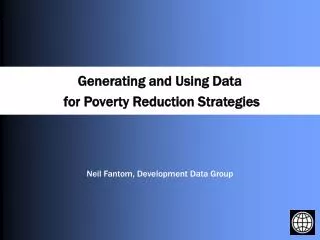
Data Provision for Poverty Reduction: Indonesia Experiences Wynandin Imawan wynandin@bps.go.id BPS-Statistics Indonesia
Poverty Incidence:INDONESIA 1976 - 2008 * * 1999 methods to calculate poverty incidents
Head Count Ratio:inter-provincial trend 2007-2008 11 ACEH 19 BANGKA BILITON 51 BALI 72 CENTRAL SULAWESI 12 NORTH SUMATRA 21 RIAU ISLANDS 52 WEST NUSATENGGARA 73 SOUTH SULAWESI 13 WEST SUMATRA 31 JAKARTA 53 EAST NUSATENGGARA 74 SOUTHEAST SULAWESI 14 R I A U 32 WEST JAVA 61 WEST KALIMANTAN 75 GORONTALO 15 JAMBI 33 CENTRAL JAVA 62 CENTRALKALIMANTAN 76 WEST SULAWESI 16 SOUTH SUMATRA 34 SR YOGYAKARTA 63 SOUTH KALIMANTAN 81 MALUKU 17 BENGKULU 35 EAST JAVA 64 EAST KALIMANTAN 82 NORTH MALUKU 18 LAMPUNG 36 BANTEN 71 NORTH SULAWESI 91 WEST IRIAN JAYA 94 PAPUA
Data Provision for Poverty Reduction [1] • BPS conducts SUSENAS, national socioeconomic survey, annually • Consumption and expenditure info. in module q’naire, sample size 68,800 hhs for provincial estimate • Welfare indicators in core q’naire, sample size 280,000 hhs for district estimate • Data produced used for planning, monitoring and evaluation progress • Poverty Reduction • Program achievement on access to education, health care, sanitation, safe water • Information produced for national, provincial, and district estimate • Poverty incidents, Head Count Ratio, Poverty Gap, Poverty Severity Index • Education indicator: enrollment rate, dropout rate, literacy rate • Health indicator: immunization, breastfeed, malnutrition status, visit rate, contact rate, • Other indicator: access to sanitation, safe water, calorie/protein intake [nat./prov.] the indicators can be produced for whole population and sub population (urban/ rural, quintile by income/capita)=> enable to produce more precise planning and assessment
Some evidences from Susenas and LFS:2006 and 2008 • Reduction Number of the Poors • 2006: 39,3 million [17,75%], 2008: 34,96 million [15,42%] • [Open] unemployment [February] decline • 2006: 11,1 million [10,4%], 2008: 9,4 million [8,5%] • Increasing monthly per capita income[IDR] 2006 [%] 2007 [%] 2008 • Q2 173,849 11.6 194,028 11.4 216,063 • Q3 230,895 13.8 262,743 11.3 292,503 • Q4 318,126 18.0 375,544 9.5 411,215 inflation rate < 8% • Empirical evidences indicate improvement of most people living
Data Provision for Poverty Reduction [2] • It is realized that, mistargeting of program assistances to the poor in the past was enormous [more than 60% of the recipients of the following assistances are not poor households] • Rice subsidy • Free health care for the poor • Free education fees for the poor students • Micro credits • Better targeting requires database containing the list of poor household in each of lowest possible settlement, e.g., hamlet in the rural and blocks in the urban/cities • In 2005 poor household identification and registration was undertaken to determine poor households entitled of cash transfers. There are 19,1 million eligible households [very poor, poor, and near poor], the data is also used for implementing programs included in Cluster 1 for the household targeting.
Data Provision for Poverty Reduction [3] • At present, the database of poor households is being updated in two ways: • Verification to exclude non-eligible households (inclusion errors) and add new poor (eligible) households • Adding individual households members characteristics on demographic, education (schooling status and attainment), disability, employment This updated poor households database is prepared for used to implementing programs included in Cluster 1. • Villages Potential data is the database available in BPS to identify backward villages in which many infrastructures are not available in those villages. The database can be used for Cluster 2 • In the 2006/2007 Economic Census data on SMEs is collected and now available for use for Cluster 3
Concluding and Implication • Set of database [macro and micro] is available for the anti-poverty programs • Significant poverty reduction in the last 2 years[HCR 2006=17.8%, HCR 2008=15.4%] • Government is confident that the poverty reduction strategy on the right track • The poverty line used by BPS to estimate the number of poor population is questioned by member of parliament, academes due to the line is lower than WB PL of 2 USD [PPP] per capita per day • FOR THE YEAR 2006 USD 1 HCR=7.4%; NPL USD 1.43 [PPP] HCR=17.8%; USD 2 HCR=49.4% • It is about political issue explored by opposition than the measurement itself • BPS is planning to review the methodology of calculating national poverty line • Citizens lawsuit against BPS [as government agency] now under trial in the court to test the validity the methodology and criteria used to identify the poor; basically the trial is meant to validate the right of BPS to identify the poor households