Download
1 / 30
300 likes | 381 Views
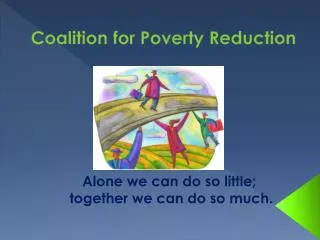
Coalition for Poverty Reduction. Alone we can do so little; together we can do so much. Survey Data. 965 Anonymous Surveys Surveys were completed by consumers at 24 different Human Service Agencies in Wexford and Missaukee Counties. County of Residence. 26 %. 69%. Gender.

E N D
Coalition for Poverty Reduction Alone we can do so little; together we can do so much.
Survey Data 965 Anonymous Surveys Surveys were completed by consumers at 24 different Human Service Agencies in Wexford and Missaukee Counties.
County of Residence 26 % 69%
Federal Poverty Guidelines For family units of more than 8 members, add $3,740 for each additional member Produced by: CMSO/DEHPG/DEEO
Self-Sufficiency in Michigan Taken from the Michigan League for Human Service May 2007
Categories for Analysis Employment and Income Physical & Mental Health Education & Training Housing Children &Families Transportation & Mobility Attitudes
What kind of community services have been very helpful to you?
What kind of additional help do you need that no program is now providing?
Estimated Household Income 2.6 2.6 2.7 3.0 3.3 3.3 4.2 3.8 Average Household Size
Physical & Mental Health Percent
Education & Training Percent
Impact of Education Percent
When you think about the life you live, how satisfied are you?
When you think about the life you live, how satisfied are you? Aggregate Average
When thinking about your future, what is your best hope for improving your life?
Key Findings • Females • Majority of the poor? • Majority using services? • Jobs • Self-sufficient wage • Availability • Skill match • Disability • Transportation • Most needed services • Dental • Vision • Medical • Barriers to Improvement • Health • Mental • Physical • Money Management • Transportation • 50% “Very/Mostly Satisfied” with Life • Don’t want to change • Don’t know how to change • Public perception • Poverty is a material problem • “Relief” is the solution
Be Part of the Solution • Become a “Navigator” • “Getting out of poverty” requires • New information • New skills • New relationships • Navigator = Information resource • Attend upcoming Poverty Simulation • Support local relief efforts • Join Wexford Missaukee Coalition for Poverty Reduction Contact Ken Nydam 231-876-3280