Download
1 / 35
350 likes | 496 Views
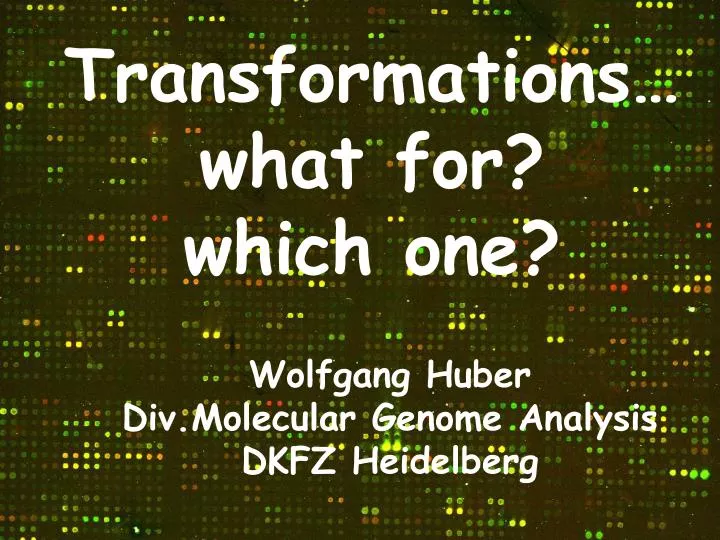
Transformations… what for? which one?. Wolfgang Huber Div.Molecular Genome Analysis DKFZ Heidelberg. Microarray intensities x 1 ,…,x n. Log-ratio with/without background correction Shrunken log-ratio (BHM) Variance stabilized log-ratio (=generalized log-ratio, “glog”).

E N D
Transformations… what for?which one? Wolfgang HuberDiv.Molecular Genome Analysis DKFZ Heidelberg
Microarray intensities x1,…,xn Log-ratio with/without background correction Shrunken log-ratio (BHM) Variance stabilized log-ratio (=generalized log-ratio, “glog”) How do you like to think about (interprete) it? How do you estimate the parameters? What comes out (the “bottom line”?)
3000 3000 x3 ? 1500 200 1000 0 ? x1.5 A A B B C C But what if the gene is “off” (below detection limit) in one condition? ratios and fold changes Fold changes are useful to describe continuous changes in expression
ratios and fold changes • Many interesting genes will be off in some of the conditions of interest • If you want expression measure (“net normalized spot intensity”) to be an unbiased estimator of abundance • many values 0 • need something more than (log)ratio • 2. If you let expression measure be biased (always>0) • can keep ratios. • how do you choose the bias?
ratios and fold changes Ratios are scale-free: But there is (at least) one absolute scale in the data: Can we use this to construct useful functions
In the following: How to compare microarray intensities with each other? How to incorporate measurement uncertainty (“variance”)? How to simultaneously and consistently deal with calibration (“normalization”)?
Systematic Stochastic o similar effect on many measurements o corrections can be estimated from data o too random to be ex-plicitely accounted for o remain as “noise” Calibration Error model Sources of variation amount of RNA in the biopsy efficiencies of -RNA extraction -reverse transcription -labeling -fluorescent detection probe purity and length distribution spotting efficiency, spot size cross-/unspecific hybridization stray signal
bi per-sample normalization factor bk sequence-wise probe efficiency hik ~ N(0,s22) “multiplicative noise” ai per-sample offset eik ~ N(0, bi2s12) “additive noise” modeling ansatz measured intensity = offset + gain true abundance
“multiplicative” noise “additive” noise The two-component model raw scale log scale B. Durbin, D. Rocke, JCB 2001
variance stabilizing transformations Xu a family of random variables with EXu=u, VarXu=v(u). Define var f(Xu ) independent of u derivation: linear approximation
1.) constant variance (‘additive’) 2.) constant CV (‘multiplicative’) 3.) offset 4.) additive and multiplicative variance stabilizing transformations
the “glog” transformation - - - f(x) = log(x) ———hs(x) = asinh(x/s) P. Munson, 2001 D. Rocke & B. Durbin, ISMB 2002
parameter estimation o maximum likelihood estimator: straightforward – but sensitive to deviations from normality o model holds for genes that are unchanged; differentially transcribed genes act as outliers. o robust variant of ML estimator, à la Least Trimmed Sum of Squares regression. o works as long as <50% of genes are differentially transcribed
Least trimmed sum of squares regression minimize P. Rousseeuw, 1980s - least sum of squares - least trimmed sum of squares
evaluation: effects of different data transformations difference red-green rank(average)
evaluation: sensitivity / specificity in detecting differential abundance o Data: paired tumor/normal tissue from 19 kidney cancers, in color flip duplicates on 38 cDNA slides à 4000 genes. o 6 different strategies for normalization and quantification of differential abundance o Calculate for each gene & each method: t-statistics, permutation-p oFor threshold a, compare the number of genes the different methods find, #{pi | pia}
evaluation: comparison of methods one-sided test for upone-sided test for down more accurate quantification of differential expression higher sensitivity / specificity
evaluation: a benchmark for Affymetrix genechip expression measures o Data: Spike-in series: from Affymetrix 59 x HGU95A, 16 genes, 14 concentrations, complex background Dilution series: from GeneLogic 60 x HGU95Av2, liver & CNS cRNA in different proportions and amounts o Benchmark: 15 quality measures regarding -reproducibility -sensitivity -specificity Put together by Rafael Irizarry (Johns Hopkins) http://affycomp.biostat.jhsph.edu
good affycomp results (28 Sep 2003) bad
position- and sequence-specific effects wi(s): Naef et al., Phys Rev E 68 (2003) Stratification wi i collaboration with R. Irizarry
glog versus "sliding z-score" sliding z-score
Availability oimplementation in R oopen source package vsn on www.bioconductor.org oBioconductor is an international collaboration on open source software for bioinformatics and statistical omics
What to do with the gene lists: the functional genomics pipeline @ DKFZ Neoplastic diseases High-throughput transcriptome sequencing: clones with unannotated full length ORFs functional characterization association of mRNA profiles with - genetic aberrations - histopathology - clinical behavior
GFP-ORF- protein BrdU incorporation expression clone DAPI: identification proliferation +activator -inhibitor CFP: expression automated microscope BrdU: proliferation Image segmentation and quantification Rainer Pepperkok, EMBL HT functional assays (S. Wiemann, D. Arlt) Library of "unknown" transcripts
Measurement of fluorescence intensities 231.6, -4.8 80.9, 68.5, SMPCell Detection of modulators of cell proliferation by automated image analysis YFP channel Cy5 channel 72.0 761.0 71.0 684.1 119.7 779.0 87.3 820.2 149.5 645.6 70.2 536.1 84.7 799.5 103.1 912.8 81.0 916.7 2621.8 267.6 74.1 766.2 156.8 866.6 169.0 819.8 105.5 757.7 156.0 367.8 76.5 746.2 135.2 731.2 86.2 567.3 77.7 896.3 92.6 1095.4 104.6 633.3 481.2 567.7 539.0 663.9 95.0 726.2 156.7 842.1 DAPI ORF-YFP Anti-BrdU/Cy5 overlay YFP – Cy5 Dorit Arlt
activationinhibition transfected cells control cells Statistical analysis of cellular assay data detect transfection effect: inh (p=10-8) Plate summary plot
Cellular assays: challenges for statisticians oImage analysis: pattern recognition, classification oLow-level analysis what are good models for calibration, “normalization”, data transformation? oHigh-level analysis models for the dependence of cellular processes on over-/underexpression of genes connect results from different assays, microarray data
Summary olog-ratio Dlog: what about genes that are not expressed in some of the conditions of interest? o generalized log-ratio Dh:a useful extrapolation - interpretability - sensitivity - specificity - computational convenience owhat to do with the gene lists? systematic (high throughput) functional assays
Acknowledgements MPI Molekulare Genetik Anja von Heydebreck Martin Vingron Uni Heidelberg Günther Sawitzki DFCI Harvard Robert Gentleman UMC Leiden Judith Boer RZPD Anke Schroth Bernd Korn EMBL Urban Liebel ...and many more! DKFZ Heidelberg Molecular Genome Analysis Annemarie Poustka Holger Sültmann Andreas Buneß Markus Ruschhaupt Katharina Finis Jörg Schneider Klaus Steiner Stefan Wiemann Dorit Arlt
Models are never correct, but some are useful True relationship: Model: linear dependence Model: quadratic dependence
generalized log-ratio difference log-ratio variance: constant part proportional part variance stabilization raw scale log glog
ratio compression Yue et al., (Incyte Genomics) NAR (2001) 29 e41