Download
1 / 6
60 likes | 124 Views
ASSIGNMENT: Write a formal scientific abstract (300 Words) based on our “study” evaluating the ability of temperature and precipitation to predict the distribution of biomes in the U.S . TYPED DOUBLE SPACED. REMINDER: Basic Methods

E N D
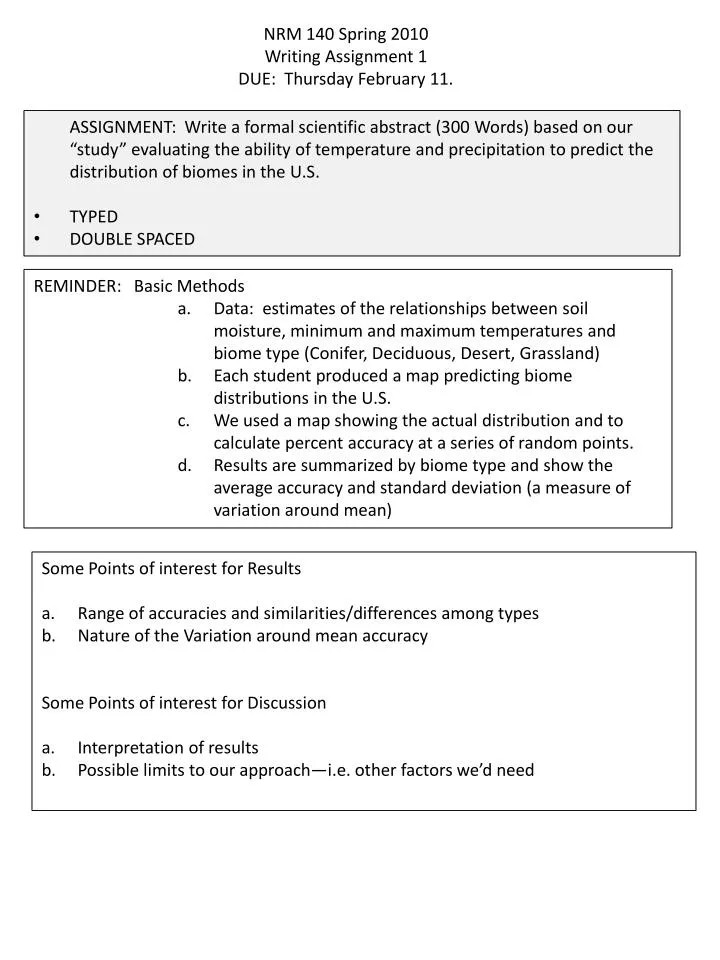
ASSIGNMENT: Write a formal scientific abstract (300 Words) based on our “study” evaluating the ability of temperature and precipitation to predict the distribution of biomes in the U.S. • TYPED • DOUBLE SPACED • REMINDER: Basic Methods • Data: estimates of the relationships between soil moisture, minimum and maximum temperatures and biome type (Conifer, Deciduous, Desert, Grassland) • Each student produced a map predicting biome distributions in the U.S. • We used a map showing the actual distribution and to calculate percent accuracy at a series of random points. • Results are summarized by biome type and show the average accuracy and standard deviation (a measure of variation around mean) NRM 140 Spring 2010Writing Assignment 1DUE: Thursday February 11. Some Points of interest for Results Range of accuracies and similarities/differences among types Nature of the Variation around mean accuracy Some Points of interest for Discussion Interpretation of results Possible limits to our approach—i.e. other factors we’d need
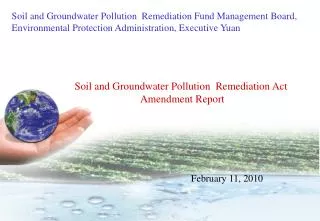
Basic Structure of a Scientific Report ABSTRACT— A single paragraph containing elements of each of the items below. Most emphasis is on results and discussion but each section should be represented. Given first but usually written LAST Introduction Provides the background information needed to understand the problem being studied. MUST be based on a survey of the current knowledge in the SCIENTIFIC literature. Provides a purpose statement and specific objectives (or hypotheses). Study Area Brief description of the location and physical setting where the study was conducted Includes a MAP Methods Detailed description of the methods used to collect and analyze data NOT a step by step set of directions but enough detail that readers could replicate the general approach Written in past tense first person Results Concise description of the general patterns in the data you analyzed (means, ranges, high vs. low values, statistical analyses) Includes RELEVANT summary tables, charts, graphs, maps etc. needed to illustrate results Discussion—along with the abstract this is the most important and challenging section to write and should be given a great deal of attention. Interpretation of your results Relates them back to the problem and objectives described in the introduction MUST include literature citations Should include the management or scientific implications of your work Can examine limitations or future research options Literature Cited Properly formatted, alphabetical list of all articles and sources cited in the text Must be consistent and use a recognized format
Sample Abstract (Based on the data given in the next slide) Cullowhee Creek is a small stream on the campus of Western Carolina University in Jackson County, North Carolina. Human alterations to the stream channel have caused changes in water flow (i.e. increased speed), increased the risk of erosion and negatively impacted wildlife habitat quality in and around the stream. Restoration efforts were implemented in 2005 to improve channel conditions and in 2008 we applied a simple survey to evaluate recovery. We used 0-1 scoring survey (1 = optimal conditions, 0 = heavy human impacts) to evaluate the effects of restoration in the following categories: land use, physical (stream channel) attributes, and biologic (wildlife and vegetation) attributes. Of the 3 major categories evaluated, land-use scored consistently between 0.50-0.60 with a mean of 0.55. Of the physical factors, both the stream channel and bank stability had average scores at or below 0.5 while the stream bottom and surface were at or above 0.70. Among biologic criteria, both aquatic vegetation and animal species scored approximately 0.40 while terrestrial vegetation and wildlife were much higher with an average score of 0.60 and 0.80 respectively. Channel and stream bank restoration improved stream bottom conditions terrestrial vegetation conditions greatly but the prevalence of human land use produced low land use scores across all sample sites. Most sites sampled were either directly affected by human activity or adjacent to human activity and land use such as residential and recreational facilities. Because of the difficulty restoring natural stream patterns, channel scores remained relatively low. Aquatic vegetation and wildlife were not abundant in any samples. Though reasons for this are unclear it is likely that the lack of forest vegetation around the stream has affected water temperature. The number of point source inputs also likely has impacted water quality. While restoration efforts were successful in improving some physical conditions further studies should examine factors affecting biological recovery.
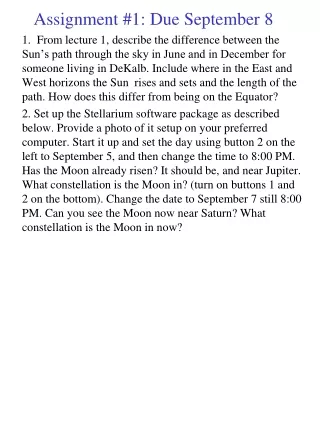
Figure 1. Average scores for criteria measured within the three major categories Land Use (Gray), Physical Attributes (Blue) and Biologic Attributes (Green).
Parts of an Abstract---ILLUSTRATION ONLY!! Abstract should be a single paragraph but contain these elements. INTRODUCTION (and study area, purpose) Cullowhee Creek is a small stream on the campus of Western Carolina University in Jackson County, North Carolina. Human alterations to the stream channel have caused changes in water flow (i.e. increased speed), increased the risk of erosion and negatively impacted wildlife habitat quality in and around the stream. Restoration efforts were implemented in 2005 to improve channel conditions and in 2008 we applied a simple survey to evaluate recovery METHODS We used a 0-1 scoring survey (1 = optimal conditions, 0 = heavy human impacts) to evaluate the effects of restoration in the following categories: land use, physical (stream channel) attributes, and biologic (wildlife and vegetation) attributes. RESULTS Of the 3 major categories evaluated, land-use scored consistently between 0.50-0.60 with a mean of 0.55. Of the physical factors, both the stream channel and bank stability had average scores at or below 0.5 while the stream bottom and surface were at or above 0.70. Among biologic criteria, both aquatic vegetation and animal species scored approximately 0.40 while terrestrial vegetation and wildlife were much higher with an average score of 0.60 and 0.80 respectively. DISCUSSION Channel and stream bank restoration improved stream bottom conditions terrestrial vegetation conditions greatly but the prevalence of human land use produced low land use scores across all sample sites. Most sites sampled were either directly affected by human activity or adjacent to human activity and land use such as residential and recreational facilities. Because of the difficulty restoring natural stream patterns, channel scores remained relatively low. Aquatic vegetation and wildlife were not abundant in any samples. Though reasons for this are unclear it is likely that the lack of forest vegetation around the stream has affected water temperature. The number of point source inputs also likely has impacted water quality. While restoration efforts were successful in improving some physical conditions further studies should examine factors affecting biological recovery.
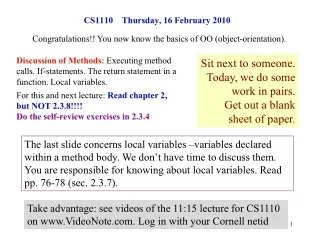
YOUR DATA Figure 1. Average accuracy (%) estimates from predictions of the U.S. biome distribution using temperature and precipitation. Error bars indicate 1 standard deviation from the mean.