Download
1 / 8

E N D
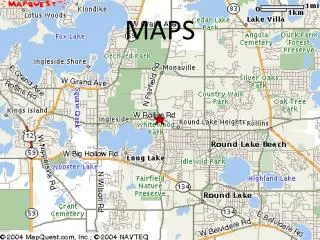
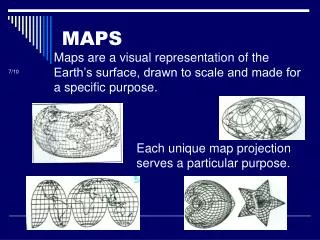
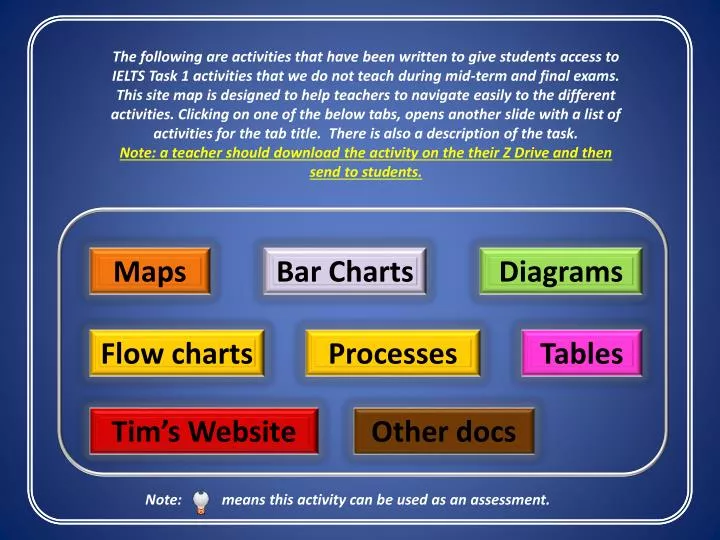
The following are activities that have been written to give students access to IELTS Task 1 activities that we do not teach during mid-term and final exams. This site map is designed to help teachers to navigate easily to the different activities. Clicking on one of the below tabs, opens another slide with a list of activities for the tab title. There is also a description of the task. Note: a teacher should download the activity on the their Z Drive and then send to students. Maps Bar Charts Diagrams Flow charts Processes Tables Tim’s Website Other docs Note: means this activity can be used as an assessment.
Sandy Town Activity 1. Student’s version Sandy Town: This is a CALL activity that allows students to copy and paste objects (houses, malls, hotels etc.) so they can develop a town that is set in 1990 to the present Teacher’s version Activity 2. Cuthbert School Activity 1. Student’s version School difference: This is a CALL activity that allows students to note the difference between the same school set in different years. One school set in 1950 and one in the present. Students identify all the differences and form a report. Activity 2. Teacher’s version Student’s version Westmere Town Activity 1. Exam version Activity 3. Westmere Town: Students describe the differences between a town that has changed over many years. This could also be used as a CALL activity. Activity 2. Teacher’s version Abu Kamal Activity 1. Abu Kamal - 1 Activity 2. Abu Kamal - 2 Abu Kamal: a similar type of activity to Westmere, but a much simpler version Click to go back to main screen Activity 3. Abu Kamal - 3 Back Activity 4. Abu Kamal - Assessement
Bar Charts Activity 1. Sentence patterns Activity 2. Questions about the chart A range of bar chart activities that allow students access to charts that can be described temporally and comparatively. The charts are set in two years (in the key) but no time on the x-axis. Activity 3. Gap fill exercise Activity 4. Model answer - Gap fill exercise Activity 5. Trends in chart Activity 6. Using linking words in the chart Activity 7. Gap fill Describing a similar bar chart that shows the number of diabetes cases in 6 countries Assessment Click to go back to main screen Back
Solar Power Activity 1. Describing the diagram Activity 2. Arrows showing how the system works A diagram that shows how a house is run on solar power. Students describe how it works. Activity 3. Gap fill & Answer Tsunami Worksheets & answers A diagram that shows how a tsunami happens and the causes. The worksheets also go into the details of how they form and change speed. Worksheets have both student sheets and answers Water cycle Assessment & answer A diagram that shows how the water cycle works. How rain forms and flows back to the oceans. Eiffel Tower Worksheets Click to go back to main screen Back A diagram that shows the Eiffel Tower and gives interesting stats on the Tower. Students answer questions and builds a report.
Flow chart Activity 1. Questions on flow chart Activity 2. Model answer & gap fill A flow chart that illustrates how students pass from UGRU to IELTS and then faculty. Activity 3. Sentence patterns Activity 4. Editing a model answer for mistakes Processes Activity 1. Student‘s version Activity 2. Teacher’s version A process that shows how bread is made and one shows how paper is made. This includes activities on using and constructing the passive. Flow chart Activity 1. Student‘s version Activity 2. Click to go back to main screen Teacher’s version A flow chart that shows the grading of exams for L3 writing. Back
How to describe large tables of information Tables Sports student version A table that shows the percentages of injuries for a range of sports. Students have to give a summary of the data. Exercise 1. A number of excellent exercises from Carlos showing tables, line graphs and bar charts. Lots of work on how the charts can be related to each other. A table that shows the percentages of injuries for a range of sports. Teachers version - answer Tables, Line graphs & Bar Charts Sports answer Exercise 2. Table that shows the most popular subjects at university for seven European countries. It also includes a pie chart for use in the introduction as a comparison – higher level students. Tables, Line graphs & Bar Charts University subjects Exercise 3. Tables, Line graphs & Bar Charts A table that is similar to the one above but much simpler. This has no pie chart and fewer countries. University subjects Exercise 4. Tables, Line graphs & Bar Charts University subjects Teacher’s version. An answer to the easier version of subjects at university. Exercise 5. Click to go back to main screen Tables, Line graphs & Bar Charts University subjects Exam version Back
A number of exercises for alternative charts Tim’s Website Diagrams Flow charts Paris A diagram of Paris and the Eiffel Tower E-commerce How on-line shopping works Garisdon Describing a town called Garisdon Acid rain How acid rain forms Vacuum cleaner Describing a vacuum cleaner Date fruit Describing the date fruit cycle Central heating Describing a central heating system Worksheets for task 1 activities for this website Bank loan How to process a bank loan Hydro-electric How hydro-electric power works Worksheets Worksheets from Richard Meech Hospital Process of hospital sterilization Click to go back to main screen Back Apartment block How an apartment block is built
L3 book (for more ideas) written by Dr. Jules St. John. Inside you will find lots of other ideas and activities for all types of charts and essay writing. L3 handbook L3 Handbook This is the rubric for use with the alternative assessment course. Rubric Rubric Exam writing book This is the writing booklet for students to write the exam in. Exam booklet This is a generic cover sheet that can be used for the exam you choose. Exam cover sheet Exam cover sheet Example for activity on water cycle Click to go back to main screen Back