Download
1 / 27
361 likes | 673 Views
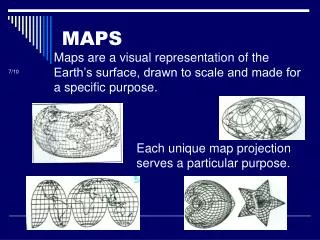
Maps. Ms. Avery July 2011. What is a map?. A map is: A picture or representation of the Earth's surface, showing how things are related to each other by distance, direction, and size.

E N D
Maps Ms. Avery July 2011
What is a map? • A map is: • A picture or representation of the Earth's surface, showing how things are related to each other by distance, direction, and size. • A map is not a photograph of the Earth's surface. It can show many things that a picture cannot show, and as a result, a map looks different in many ways from a photograph of the Earth's surface.
A Universal Understanding • Maps are a universal medium for communication, easily understood by most people, regardless of language or culture. • Old maps provide much information about what was known in times past, as well as the philosophy and cultural trends taking place at the time the map was made. (i.e the earth is flat) • Maps are one means by which scientists distribute their ideas and pass them on to future generations
Cartography • The study and practice of making maps. • The first maps were of constellations, not the earth.
The History of Maps • The oldest known maps are preserved on Babylonian clay tablets from about 2300 B.C. • Medieval maps: European maps were dominated by religious views. In this map format, Jerusalem was depicted at the center and east was oriented toward the map top. Maps were drawn by hand which made distribution very difficult.
The History of Maps • Renaissance maps: The first whole-world maps began to appear in the early 16th century, following voyages by Columbus and others to the New World. The first true world map is generally credited to Martin Waldseemüller in 1507.
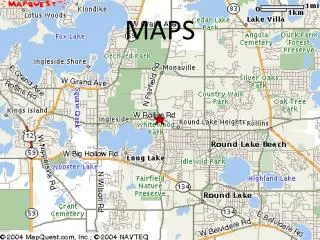
Modern Maps • Much of the world was poorly known until the widespread use of aerial photography following World War I. Modern cartography is based on a combination of ground observations and remote sensing. • Today maps are used by people to find places they have not seen. If you were trying to locate a high school on your local map…. • The scale on the map can help you determine the distance and the legend reveals what map symbol is a high school. The direction in which you should walk can also be determined. However, you may need a compass to walk in the direction.
Types of Maps • There are several different types of maps, each created for a specific purpose. The different map types are: • Political • Physical • Economic/Resource Maps • Climate • Topographic • Historic
Political Maps • Do not show physical features. Instead, they indicate state and national boundaries and capital and major cities.
Physical Maps • Illustrate the physical features of an area, such as the mountains, rivers and lakes. • The water is usually shown in blue. Colors are used to show relief—differences in land elevations. Green is typically used at lower elevations, and orange or brown indicate higher elevations.
Economic/Resource Maps • Feature the type of natural resources or economic activity that dominates an area. Cartographers use symbols to show the locations of natural resources or economic activities. For example, oranges on a map of Florida tell you that oranges are grown there.
Climate Maps • Give general information about the climate and precipitation (rain and snow) of a region. Cartographers (map makers) use colors to show different climate or precipitation zones.
Topographic Maps • Include contour lines to show the shape and elevation of an area. Lines that are close together indicate steep terrain, and lines that are far apart indicate flat terrain.
Historical Maps • A map that shows things or events from the past
Other Geography Tools • Geographers use the 5 themes to categorize the information that they discover, but what tools do they use to find this information? • Geographers use things like: • maps • geographic information systems • remote sensing • observations
Geographic Information Systems(GIS) • GIS is: a tool that allows geographers and analysts to visualize data in several different ways in order to see patterns and relationships in a given area or subject. • One set of data is layered on top of another to show patterns and relationships. For example, elevation at specific locations can show up in the first layer and then rates of precipitation at various places in the same area can be in the second. Through a GIS, analysis patterns about elevation and the amount of precipitation then arise.
Remote Sensing • The use of "indirect" devices to probe the earth and other planets. It involves the use of aerial photographs, satellite images, and radar, to obtain information about the earth and other planets. The weather maps that are used daily on the local weather is one of the most obvious uses of remote sensing.
Observations • Directly interviewing people to learn about a place • Observing at a distance to understand people and their culture
Map Basics • Legend/Key: shows the user what different symbols mean. For example, a star inside a cirlce indicates the capital city. • Scale: indicates the relationship between a certain distance on the map and the distance on the ground. For example, 1 inch = 100 miles • Orientation: what direction the map is set up. This is usually indicated by a compass rose and an arrow pointing North