Download
1 / 16
160 likes | 175 Views
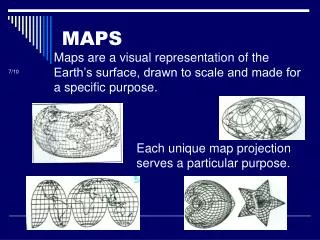
Maps. Maps. A map is a symbolic representation of the surface of a planet There are many different ways this representation can be accomplished Maps vary in the information they carry Maps vary in the way they present that information

E N D
Maps • A map is a symbolic representation of the surface of a planet • There are many different ways this representation can be accomplished • Maps vary in the information they carry • Maps vary in the way they present that information • That is, the same information can be presented in different ways
How to read maps • Give this variation, how do you know how to read maps? • The legend • Example: the representation of elevation, i.e., topography • Pictographs (Drawing hills) • Hachure = density of hachure represents slope • Hypsometry = contour lines • Hypsometric tinting = color represents elevation • Shaded relief = shadows indicate height of relief
USGS Topographic 1:24,000 quadrangle map showing contour lines
Contour lines • Contour lines mark lines of constant elevation. • They never cross, but can overlap • Closed depressions are often indicated by contours that have tick marks pointing inward • Bundles of lines close together indicate steep slopes • Few lines far apart indicate relatively flat ground • Choice of interval can be difficult if there are both flat and steep areas in the same map • The contour interval should appear in the legend • Contour interval can be calculated from the labeled contour lines