Download
1 / 24
250 likes | 318 Views
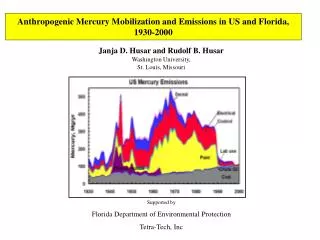
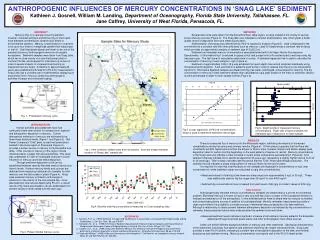
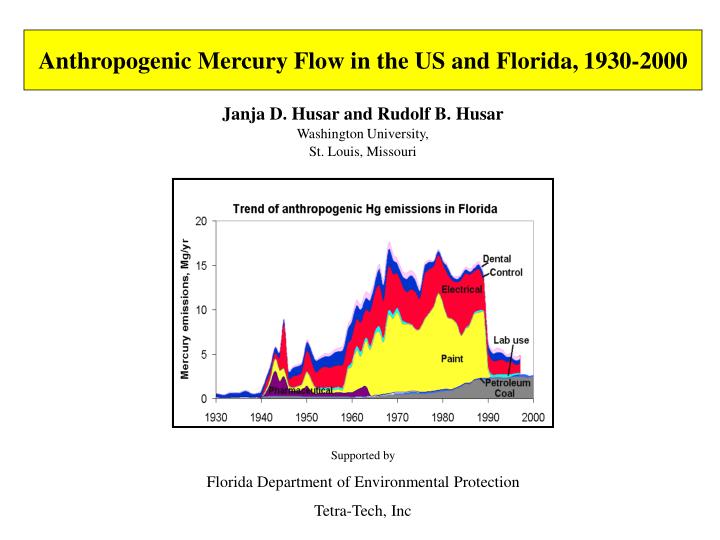
Anthropogenic Mercury Flow in the US and Florida, 1930-2000. Janja D. Husar and Rudolf B. Husar Washington University, St. Louis, Missouri. Supported by Florida Department of Environmental Protection Tetra-Tech, Inc. Background.

E N D
Anthropogenic Mercury Flow in the US and Florida, 1930-2000 Janja D. Husar and Rudolf B. Husar Washington University, St. Louis, Missouri Supported by Florida Department of Environmental Protection Tetra-Tech, Inc
Background • Elevated mercury levels are present in the upper levels of the food chain in southern Florida. • Recently, a significant decline of mercury in birds was observed. • The cause of the sharp decline is not well understood. The objective of this study is to: Assess the trends of mercury flow in Florida since 1930
Approach Multi-Scale: National, Florida, Southern Florida • National Mercury Flow • Mercury from mining • Mercury in fuels
Mercury mobilized in coal • Each coal mining region has a specific Hg content; USGS has extensive data for each coal region • Hg mobilization = S (Hg Conc. X Coal Production) • Most of coal in FL is from the Appalachian Basin • The total Hg mobilized in coal has been 80-160 Mg/yr since 1900 • The Hg fraction emitted during combustion is 50-75% • The coal Hg emission ranged 60- 120 Mg/year
Mercury Mobilized in Petroleum Unlike for coal, the Hg content of crude oil is highly variable and the data are sparse. Measured crude oil Hg concentration ranges between 10 and 30000 ppb. Fate of Hg in Crude Oil Assuming 10 ppb in crude oil “Other” still gas, naphtas, unfinished oils, petroleum coke (consumed at refineries and electric utilities),etc
Mercury Mobilized in Goods: Electrical Sector • Batteries were dominant until 1990 • Hg in alkaline batteries were discontinued, beginning the 1980s • Hg is still used in lights and switches • Consistency of ‘electrical’ Hg use: • Bureau of Mines reports Hg consumption • Franklin reports Hg in discarded goods
Mercury in Paint • Phenyl mercuric compounds used as fungicide in water-type (latex) interior and exterior paints • Water-type paint consumption was increasing since the 1950s • The average paint Hg concentration (Hg used/Water Paint shipped) was declining from >300 ppm
US Mercury Mobilization Trend Hg Mobilization: Goods • Electrical, batteries • Control, manometers • Dental, amalgamation • Pharmaceuticals • Chlor-alkali • Agriculture, fungicide • Paint, fungicide • Lab use • Other Fuels - Coal - Crude Oil Data: Bureau of Mines (BOM), USGS, and DOE
Mercury Flow -> Atmospheric Emissions • Electrical • Control • Lab use • Dental • Pharmaceuticals • Atmospheric emission fraction is estimated for each mercury flow category • Emission = Hg flow in goods and fuels * Emission fraction 100% AIR • Petroleum • Coal 50-75% Air+Land 66% • Paint • Agriculture 0% Land
Mercury Emissions: USA • The US mercury emissions were estimated based on the Hg flow and emission fractions • Nationally, coal combustion and electrical use contributed the bulk during 1930-1990 • Note the the significant paint contribution to the atmospheric emissions, 1960-1990
Mercury Flow: US -> Mercury Flow: Florida Mercury Flow: US Mercury Flow: Florida • Electrical • Control • Lab use • Dental • Pharmaceuticals • Paint Population prorated Acreage use prorated • Agriculture Florida specific • Coal • Petroleum
Mercury in Coal and Petroleum: Florida Source of Coal Hg E Kentucky • The Hg mobilized in coal increased to about 5 Mg/yr • The coal Hg emission ranged 2.5 - 4 Mg/year in the 1990s • The Hg in oil products reached ~0.2 Mg/yr • Motor gasoline and residual fuel oil are the main contributors • Note that petroleum Hg is <<< Coal Hg
Mercury Flow in Florida Cumulative Hg Flow: ~2000 Mg/70 yrs Mercury flow in Florida has been steadily increasing until the 1980s The electrical sector (batteries) was dominant throughout the period The electrical sector contributed 50% of the cumulative Hg flow (1930-2000).
Mercury Emissions:US and Florida • The US Hg emission ranged between 300-500 Mg/yr (1940-1990). • The Florida Hg emissions have increased from 5 to 15 Mg/yr during the 1940-1990 period. • Nationally, coal was a significant contributor throughout the period. • In Florida, coal became significant in the 1990s
Mercury Emissions: Comparison of Florida DEP – Material Flow Method • In the 1990s, the Hg content of goods and paints has declined dramatically due to environmental regulations. • Hg from coal combustion became comparable to the Hg in goods. • The mercury emissions were estimated by the Florida DEP for Waste to Energy (WTE) incinerators. • The corresponding (electrical, lab, control) emission estimates by the material flow method yield similar results.
Summary • Hg mobilization is driven by combustion of Hg containing fuels (coal and oil) and by Hg use for goods (batteries, instruments, paints) . • The US mercury flow peaked in 1960-1990 period at about 2000 Mg/yr, followed by sharp decline in the 1990s due to environmental regulations. • The peak US atmospheric mercury emission rate was about 400 Tons/yr in the 1960-1990 period. • In Florida, the mercury flow and emission rate has increased rapidly in the late 1960s, and dropped sharply in the 1990s. • The Hg flow and emission trends for Florida are now being reconciled with other data as part of the FCG and FL-DEP Mercury Trend Project.
Waste Combustion Fraction and Rate • The emission fraction of municipal waste was between 10 and 30% for the US • The decline (1960-1980) was due to closing of incinerators • Recent increase is due to regulated incineration (WTE) units • Data
Mercury Flow: US -> Mercury Flow: Florida Mercury Flow: US Mercury Flow: Florida • Electrical • Control • Lab use • Dental • Pharmaceuticals • Paint Population prorated • Florida Mercury Flow: Approach Acreage use prorated • Agriculture Florida specific • Coal • Petroleum
Broward County mercury flow and emissions Paint and electrical goods contribution was the largest in the Broward County.
Mercury in Agriculture: Florida • Florida mercury agriculture use
Comparison of RMB and flow method • Three county comparison. Electrical, control, and lab use were incinerated at reported WTE rates, for 1990-1998. 1980-1980 incineration was apportioned using Florida factors
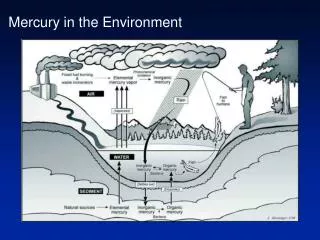
Biomagnifications of Hg • Atmosphere is a transmission medium – no accumulation • Mercury is successively concentrated in the food chain.
Mercury Flow Methodology • Flow method is based on mass balance applied to environmental compartments • Mercury flow through the ‘environment’ begins by mining of minerals and fuels • Along the flow, mercury is discarded to air, land and water
Waste Combustion Fraction and Rate • The emission fraction of municipal waste was between 10 and 30% for the US • The decline (1960-1980) was due to closing of incinerators • Recent increase is due to regulated incineration (WTE) units • Paint mercury in FL occurred in 1960-1990 • Assuming 75% emission fraction, the emission rate was ~8 Mg/yr for 1970-1990.