Download
1 / 12
120 likes | 232 Views
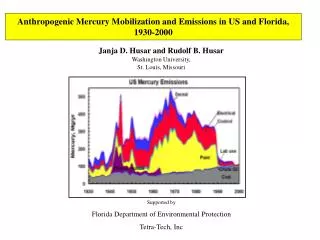
Trends of Mercury Emission Drivers for Southern Florida 1980-2000. Janja D. Husar and Rudolf B. Husar Prepared for: State of Florida Department of Environmental Protection May 2001. Background. Elevated mercury levels were found in the upper levels of the food chain in southern Florida.

E N D
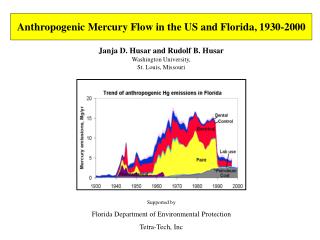
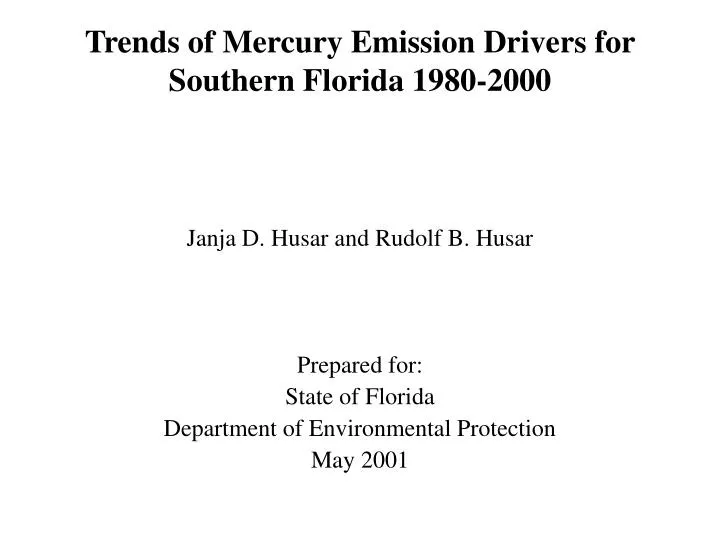
Trends of Mercury Emission Drivers for Southern Florida 1980-2000 Janja D. Husar and Rudolf B. Husar Prepared for: State of Florida Department of Environmental Protection May 2001
Background • Elevated mercury levels were found in the upper levels of the food chain in southern Florida. • Recently, a significant decline of mercury in birds was observed. • The cause of the sharp decline is not well understood.
Objectives: • Estimate the major emission driving activities (emission drivers) that cause the emissions of mercury to the atmosphere over southern Florida. • Combine the emission drivers with emission factors (contributed by others) to estimate the atmospheric emission trends of mercury over the 20 years .
Major source types of atmospheric mercury • Fossil fuel combustion • Municipal waste incineration • Medical waste incineration • Miscellaneous sources
Coal Consumption in Power Plants • The coal consumption in power plants has remained constant during 1992-2000. • There is about 10% seasonal variation in the coal consumption, summer peaked. • Most of the utility coal consumption was in the Tampa-Orlando corridor . 1992-2000 Power Plant Average/Month
Oil Consumption in Power Plants • The oil consumption in power plants between 1992-2000 has varied by about factor of two from one year to another. No clear trend is evident. • There is about factor of 2-3 seasonal variation with a strong summer peak. • Most (>80%) of the utility oil consumption was in southern Florida. 1992-2000 Power Plant Average/Month
Natural Gas Consumption in Power Plants • The natural gas consumption in power plants between 1992-2000 has varied by about 50% from one year to another. The peak consumption was in 1995. • There is about factor of 2 seasonal variation with a strong summer peak. • Over >60% of the utility natural gas consumption was in South Florida. 1992-2000 Power Plant Average/Month
Southern Florida Municipal Solid Waste (MSW) Combustion • The total capacity to burn MSW in Florida is about 7,000,000 t/yr. • There are 13 Waste To Energy (WTE) facilities in the state, 12 located in coastal zones of southern Florida. Source: Florida DEP County MSW summary sheets Since 1989 there was an increase of waste combustion, followed by a sharp decline since 1995.
Biomedical Waste Generation (2000) • Biomedical waste generation in Florida, in year 2000 was ~50,000 t/yr (DEP, FL, 2000). • Small generators (<25lb/month) contribute about 5% of the medical waste. • Larger generators (14,000 facilities) contribute 95% of the medical waste.
Medical Waste Incineration • There are two previous mercury emission estimates for years 1990 (KBN, 1992), and 1996 (RMB, 1998). • In 1990 in Dade and Broward counties >50,000 t/yr medical waste was incinerated in 33 facilities. • In 1996 in Dade and Broward counties <20,000 t/yr medical waste was incinerated in only 9 facilities. • In 1999 <8,000t/yr was incinerated only in 2 facilities. • Change in medical waste handling or reporting?
Commercial Biomedical Waste Treatment Facilities • Since 1990 there was a significant decline in number of hospitals that incinerate their own medical waste. • Commercial biomedical waste treatment facilities took over the handling of medical waste. • Commercial methods used are: • Incineration • Autoclave • Electron Beam • In southern Florida incineration commercial facilities are located in only 2 counties: • Polk • Pinnelas
Summary (progress report) • Fossil fuel consumption over southern Florida can be estimated with reasonable certainty (+/- 10-15%??). • Municipal waste combustion data since 1989 are available, but need cross checking. Data prior to 1989 are not readily available. • Medical waste incineration data are accessible through AORs; since 1990 the available data indicate a factor of 10 decline of medical waste incineration: the trend data need significant further verification. • The combination of emission drivers and emission factors (supplied by others) as well as the examination of the resulting emission trends is to be conducted in June 2001.