Download
1 / 19
190 likes | 194 Views
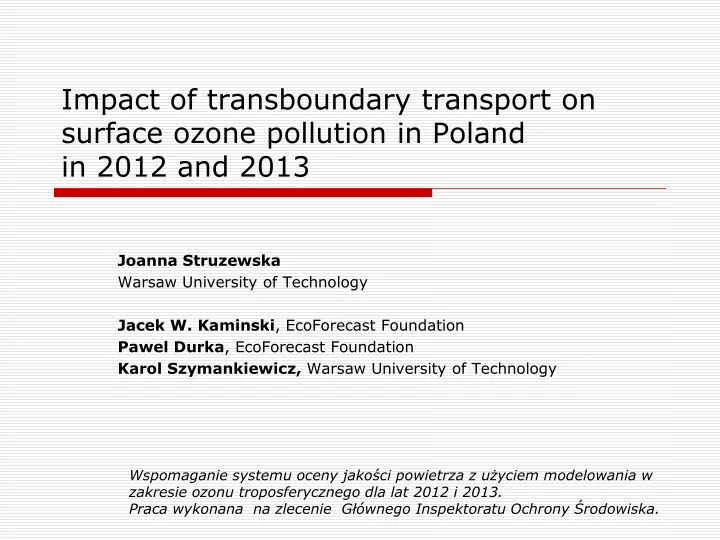
Impact of transboundary transport on surface ozone pollution in Poland in 2012 and 2013. Joanna Struzewska Warsaw University of Technology Jacek W. Kaminski , EcoForecast Foundation Pawel Durka , EcoForecast Foundation Karol Szymankiewicz , Warsaw University of Technology.

E N D
Impact of transboundary transport on surface ozone pollution in Poland in 2012 and 2013 Joanna Struzewska Warsaw University of Technology Jacek W. Kaminski, EcoForecast Foundation PawelDurka, EcoForecast Foundation Karol Szymankiewicz, Warsaw University of Technology Wspomaganie systemu oceny jakości powietrza z użyciem modelowania w zakresie ozonutroposferycznego dla lat 2012 i 2013.Praca wykonana na zlecenie Głównego Inspektoratu Ochrony Środowiska.
Outline • Ozone assessment in Poland in 2012 and 2013 • GEM-AQ model description and configuration • Emission data processing • Modelling results evaluation • Trasboundary impact on ozone exposure diagnostics • Summary
Ozone assessment in Poland • Responsible institution - National Inspectorate for Environmental Protection • Modelling centre: Warsaw University of Technology (Department of Environmental Engineering) + EcoForecast Foundation • 2012, 2013 • Modelling results on national scale (in two resolutions – 15km and 5 km) delivered to VIEPs by the end of March next year • Impact of transboundary transport assessed at 15km resolution
GEM-AQ model description 1/2 • GEM-AQ developed by the Multiscale Air Quality Network coordinated by York University in Canada • Host meteorological model – the Global Environmental Multiscale (GEM) (Côté, et al., 1998) – Canadian operational weather forecast model • Tracer transport, vertical diffusion and deep convection • Gas phase chemistry • Photodissociation rates – on-line • Wet chemistry • Aerosol chemistry and physics
GEM-AQ model description 2/2 • On-line coupling • Gas phase chemistry • Extended ADOM II • 52 chemical species • VOC - lumped molecular approach • 116 chemical reactions, 19 photochemical reactions • Dry and wet removal • Aerosol module • Aerosol chemistry and physics based on CAM (Gong, 2003) • 5 chemical types (OC, BC, sulphates, sea salt, dust) • 12 size bins 0.005 - 20.48 m • Heterogeneous reactions • Advection and diffusion as for water vapour in the host meteorological model
GEM-AQ model configuration • Timestep: • 450 sec – global simulation • 120 sec – nested simulation • Objective Analysis from CMC every 12 hours • Output for nested simulation – every hour 28 verticallayersup to 10 hPa Resolution: 0.125 degglobalvariablegrid - coreover Central Europe, 0.05 degnestedgridover Poland
Anthropogenic emission • EMEP inventory • All reported species (SOx, NOx, VOC, CO, PMs, NH3) • EMEP domain – MERCATOR 0.5ox0.5o • SNAP (01-10) • Annual average • Unit: [Mg(species)/cell] • Ozone assessment 2012 inventory valid for 2010 • Ozone assessment 2013 inventory valid for 2011
Emission flux relocation SNAP7 SNAP2 NO2 – SNAP07
DeltaTool – daily maximum scatterplot 2012 2013
DeltaTool – Taylor diagram 2012 2013
DeltaTool – Target plot 2012 2013
Transboundary transport • No anthropogenic emissions over Poland • Measures AD = ZeroPL – Base_run RD = AD / Base_run *100%
Number of days < 120 μg/m3 2012 2013
SOMO35 2012 2013
AOT40 2012 2013
Summary • Modelling results meet model accuracy requirements defined in the 2008/50/EC Directive • Different direction of the impact of transboundary transport on ozone pollution in 2012 and 2013 • Highest transboundary impact along borders and southern direction • In 2012 role of country emissions more important • Based on measurements: • In 2012 highest number of regional scale photochemical episodes over Poland (32 days in 2012 and 10 days in 2013) • Highest number of information threshold exceedings in 2013 • Level of exposure similar – higher ozone background in 2013