Download
1 / 13
130 likes | 133 Views
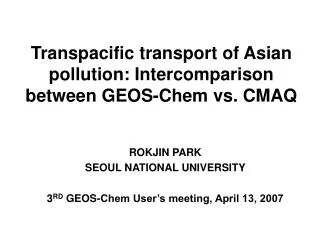
Transpacific Transport of Ozone Pollution During INTEX-B. Lin Zhang, D. J. Jacob, M. A. Avery, W. H. Brune, T. Campos, C. A. Cantrell, R. C. Cohen, F. M. Flocke, B. Heikes, G. Huey, L. Mauldin, G. W. Sachse, H. B. Singh, A. J. Weinheimer, P. O. Wennberg and the TES Science Team.

E N D
Transpacific Transport of Ozone Pollution During INTEX-B Lin Zhang, D. J. Jacob, M. A. Avery, W. H. Brune, T. Campos, C. A. Cantrell, R. C. Cohen, F. M. Flocke, B. Heikes, G. Huey, L. Mauldin, G. W. Sachse, H. B. Singh, A. J. Weinheimer, P. O. Wennberg and the TES Science Team INTEX-B Meeting (March 6 2007, Virginia Beach)
INTEX-B flight tracks GEOS-Chem CTM • Global 3-D model of atmospheric chemistry • Coupled tropospheric ozone-aerosol chemistry (~100 interacting species) • Driven by assimilated meteorology from NASA GMAO • 2º x 2.5º horizontal resolution, 30 layers in the vertical • Evaluations of the GEOS-Chem tropospheric O3 simulation, and evaluations of continental outflow and intercontinental transport of O3 and CO have been presented by a number of studies (e.g. Heald et al.[2003], Hudman et al., 2007). • We doubled the Asian emissions relative to Streets’ 2001 emissions for the INTEX-B study.
Comparisons of mean vertical profiles of CO, NO2, PAN and ozone DC8 CO NO2 Ozone PAN C130
Comparisons of mean vertical profiles of OH, HO2, H2O2 and HNO4 DC8 OH HO2 H2O2 HNO4 C130
Ozone production in transpacific plumes Objective: characterize ozone production in transpacific plumes using the ensemble of aircraft and satellite observations together with the GEOS-CHEM simulation Enhanced gross ozone production from Asian emissions at 800 hPa L H
Conversion from PAN to NOx in the subtropics The mean Asian ozone, CO, NOx, and PAN enhancements over the North Pacific at 800 hPa during the INTEX-B period CO Ozone NOx PAN Latitudinal distribution of NO2 and PAN below 4 km NO2 PAN
B A B A Aircraft measured transpacific plume on May 9th A-south branch NO GEOS-Chem Tropospheric CO Column on May 9 PAN CO O3 HNO3 Simulated net ozone production at 680 hPa on May 9 B-north branch Solid: observations Dot: GEOS-Chem PAN O3 CO
TES observations of the transpacific plume Tropospheric CO column TES GEOS-Chem with TES AK GEOS-Chem May 5 May 6 May 7 May 8 May 9
TES observed transpacific transport of ozone pollution Ozone concentration at 500 hPa GEOS-Chem with TES AK GEOS-Chem simulated Asian ozone enhancement TES May 5-6 May 7-8 May 9-10
Proposed paper for INTEX-B special issue Zhang et al., Ozone production in transpacific pollution plumes: an integrated perspective from aircraft, satellite and model • Are China emissions increasing? Aircraft and MOPITT observations suggest China CO emission increase by 70% relative to 2001. • There are two types of transport of ozone pollution. One directly from Asian; a large portion of ozone can be produced at 25-40N from PAN decomposition. • Transpacific plumes often split into two branches. Ozone production can take place in the south branch driven by PAN decomposition. • O3-CO correlations from aircraft observations show further evidence of ozone production over the subtropics regions. • TES daily observations can identify transpacific transport of ozone pollution. • Implication for surface ozone air quality in the United States (7 ppbv surface Asian ozone enhancement at California for the mean of INTEX-B period)
Altitude-longitude section of the Asian ozone enhancement at 30-40N for the INTEX-B period mean for the May 5-11 plume NA
MOPITT and AIRS observations of the Asian plume Total CO column MOPITT (AM) AIRS May 5 May 6 May 7 May 8 May 9