Download
1 / 23
230 likes | 320 Views
A Review of Disability Data for the Institutional Population of Working Age. Peiyun She David C. Stapleton Cornell Institute for Policy Research Presented to participants of the Cornell StatsRRTC C onference on: The Future of Disability Statistics: What We Know and Need to Know

E N D
A Review of Disability Data for the Institutional Population of Working Age Peiyun She David C. Stapleton Cornell Institute for Policy Research Presented to participants of the Cornell StatsRRTC Conference on: The Future of Disability Statistics: What We Know and Need to Know October 5, 2006 Washington, DC
Motivation • Limited disability data and research for the institutional population versus the non-institutional population, especially for working-age people. • Impact of trends in institutionalization on trends of disability prevalence in the non-institutional population and the distributions of their socio-demographic characteristics. • Difficulty in assessing the effects of policy efforts in promoting people with disabilities to live in the community. • Possible effects of trends in institutionalization on persistent declines in employment among non-institutional working-age people with disabilities.
Group Quarters (GQ) • Non-institutional GQ • Military quarters • College dormitories • Other non-institutional GQ (e.g., group homes, shelters, etc.) • Institutional GQ • Correctional institutions • Nursing homes • Other institutions (e.g., mental hospitals, juvenile institutions, etc.)
Data Sources • 1990 and 2000 Census • Population estimates from the Bureau of the Census • BJSsurveys • Survey of Inmates of Local Jails • Survey of Inmates of State and Federal Correctional Facilities • National Nursing Home Survey
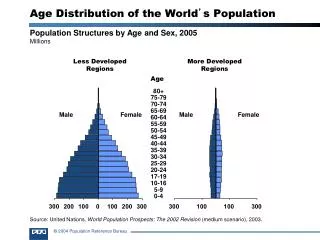
Outline • The size and distribution of the institutional population. • The size, distribution, and characteristics of the institutional population with disabilities. • Disability prevalence for people living in correctional institutions andnursing homes. • Rate of institutionalization over time. • Gaps in coverage, timing, and disability definitions.
Size and Proportion of the Institutional Populations,1990 and 2000 Source: Census 1990 and 2000.
Distribution of the Institutional Population by Institution Type, 1990 and 2000 Source: Census 1990 and 2000.
Institutional Population of Working Age (18-64), 1990 and 2000 Source: Census 1990 and 2000.
Age Distribution of the Institutional Population by Institution Type, 2000 Source: Census 2000
Distribution of People in Various Age Groups by Institution Type, 2000 Source: Census 2000
Census 2000 Disability Measures • Self-care (bathing, dressing, or getting around inside the home) • Mental (learning, remembering, or concentration) • Physical (walking, climbing stairs, reaching, lifting, or carrying) • Sensory (blindness, deafness, or a severe vision or hearing impairment) • [Go outside home] (going outside the home alone to shop or visit a doctor’s office) • [Employment] (working at a job or business)
Disability Prevalenceby Living Quarters, 2000 Source: Census 2000
Distribution of People with Disabilities by Living Quarters, 2000 Source: Census 2000
Working-agePeople with Disabilities Living in Institutions, by Gender and Race, 2000 • The share of males is much larger than the share of females (7.7% versus 1.7%). • They are also disproportionately African American (38.6% of those ages 18-49 and 22.4% of those ages 50-64).
BJS Surveys Disability Measures,1996 - 97 • Physical disability • Sensory disability (vision, hearing, speech) • Learning disability (such as dyslexia or attention deficit disorder) • Mental disability (mental or emotional condition) • Work disability (limitation in the kind or amount of work one can do)
Disability Prevalence in the Incarcerated Population,1996 - 1997 Source: BJS Surveys
Changes in Incarceration Rate by Age and Sex, 1989 - 91 to 1996 - 97 Source: Authors’ calculations.
Disability Prevalence in the Nursing Home Population, 1999 Source: NNHS
Changes in Nursing Home Residence Rate by Age, 1977 to 1999 Source: Authors’ calculations.
Gaps in Survey Coverage • Institutional GQ: Nursing home and incarcerated populations are covered in periodic surveys, but not residents of other institutions. • Non-institutional GQ: Limited information for the homeless and military populations.
Infrequent Collection • Census long form survey: once per decade. • BJS surveys: roughly every six years (1989-91, 1996-97, and 2002-04). • NNHS: biennially from 1995 to 1999, and the most recent one five years later, in 2004. • Some major national household surveys: annually.
Discussion • Change in the size and composition of the institutional population. • Relatively high disability prevalence in the incarcerated population and the growth in incarceration. • Decline in the nursing home residence rate. • The inclusion of the GQ population in the ACS from 2006 forward.