Download
1 / 5
50 likes | 117 Views
AGE. f. Cu.f. u.c.b. The projected population of the U.K. for 2005 ( by age ). ( yrs ). (m). (m). ( yrs ). 0 – 9. 7. 7. 10. 10 – 19. 8. 15. 20. 20 – 29. 7. 22. 30. 30 – 39. 9. 31. 40. 40 – 49. 9. 40. 50. Age (yrs). 50 – 59. 8. 48. 60. 60 – 69. 6. 54. 70.

E N D
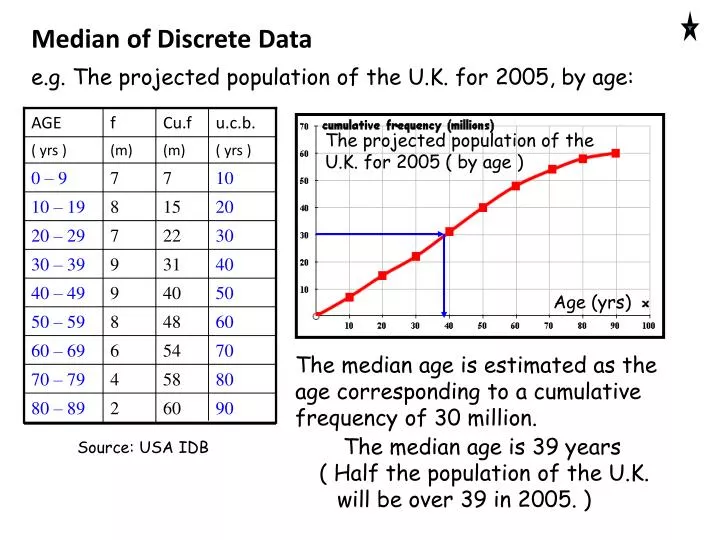
AGE f Cu.f u.c.b. The projected population of the U.K. for 2005 ( by age ) ( yrs ) (m) (m) ( yrs ) 0 – 9 7 7 10 10 – 19 8 15 20 20 – 29 7 22 30 30 – 39 9 31 40 40 – 49 9 40 50 Age (yrs) 50 – 59 8 48 60 60 – 69 6 54 70 70 – 79 4 58 80 80 – 89 2 60 90 Source: USA IDB Median of Discrete Data e.g. The projected population of the U.K. for 2005, by age: The median age is estimated as the age corresponding to a cumulative frequency of 30 million. The median age is 39 years ( Half the population of the U.K. will be over 39 in 2005. )
AGE f Cu.f u.c.b. The projected population of the U.K. for 2005 ( by age ) ( yrs ) (m) (m) ( yrs ) 0 – 9 7 7 10 10 – 19 8 15 20 20 – 29 7 22 30 30 – 39 9 31 40 40 – 49 9 40 50 Age (yrs) 50 – 59 8 48 60 60 – 69 6 54 70 70 – 79 4 58 80 80 – 89 2 60 90 Source: USA IDB e.g. The projected population of the U.K. for 2005, by age: The projected population of the U.K. for 2005 ( by age ) The quartiles are found similarly: lower quartile: 20 years LQ = (n+1)th item of data upper quartile: 56 years UQ = (n+1)th item of data The interquartile range is 36 years
Median of Continuous Data This is the value which occurs half way so the probability that a value is less than the median is P(x < m) = P(x > m) = so Area under y = f(x) between ‘a’ and ‘m’ is where ‘a‘ is the lower boundary of the P.D.F and ‘m‘ is the median Quartiles : these are the values which divide the P.D.F up into and ranges . P(x < LQ) = 0.25 P(x < UQ) = 0.75 So find the area as in finding the median.
Ex1 p.d.ff(x) = x 0 < x < 4 Median divides the area in If x = m then f(x) = m Area = mm = 0.5 As P(x < m) = 0.5 Area = baseht m2 = 0.5 m2 = 8 m = 8
For a curve integration is again used Ex2 Find the median Area = As area = up to the median Area = Am = A0 = 0 Area = Am - A0 = - 0 = 0.5 as area = 0.5 up to the median Solving = 0.5 m = m = 1.587


![Projected Senior Population Growth in the State of Michigan [Infographic]](https://cdn4.slideserve.com/7250670/slide1-dt.jpg)