Download
1 / 28
290 likes | 622 Views
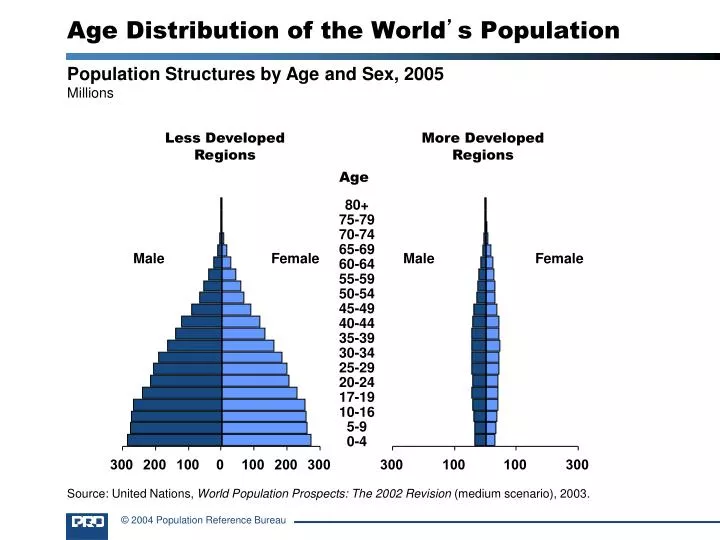
Age Distribution of the World ’ s Population. Population Structures by Age and Sex, 2005 Millions. Less Developed Regions. More Developed Regions. Age. 80+ 75-79 70-74 65-69 60-64 55-59 50-54 45-49 40-44 35-39 30-34 25-29 20-24 17-19 10-16 5-9 0-4. Male. Female. Male. Female.

E N D
Age Distribution of the World’s Population Population Structures by Age and Sex, 2005 Millions Less Developed Regions More Developed Regions Age 80+ 75-79 70-74 65-69 60-64 55-59 50-54 45-49 40-44 35-39 30-34 25-29 20-24 17-19 10-16 5-9 0-4 Male Female Male Female Source: United Nations, World Population Prospects: The 2002 Revision (medium scenario), 2003.
Birth and Death Rates, Worldwide Rates of birth, death, and natural increase per 1,000 population Natural Increase Source: United Nations, World Population Prospects: The 2002 Revision (medium scenario), 2003.
Desire for Smaller Families Women With Two Children Who Say They Want No More Children Percent Source: ORC Macro, Demographic and Health Surveys, 1988-2000.
Largest Cities, Worldwide Millions 1950 2000 2015 Source: United Nations, World Urbanization Prospects: The 2003 Revision (medium scenario), 2004.
Trends in Aging, by World Region Population Ages 65 and Older Percent Source: United Nations, World Population Prospects: The 2002 Revision (medium scenario), 2003.
Trends in Life Expectancy, by Region Life Expectancy at Birth, in Years Source: United Nations, World Population Prospects: The 2002 Revision (medium scenario), 2003.
Trends in Population Growth Worldwide Population Increase and Growth Rate, Five-Year Periods Percent increase per year Millions Source: United Nations, World Population Prospects: The 2002 Revision (medium scenario), 2003.
Women of Childbearing Age and Fertility Worldwide Source: United Nations, World Population Prospects: The 2002 Revision (medium scenario), 2003.
World Population Growth, in Billions Number of years to add each billion (year) All of Human History (1800) 123 (1930) 33 (1960) 15 (1975) 12 (1987) 12 (1999) 13 (2012) 16 (2028) 26 (2054) Sources: First and second billion: Population Reference Bureau. Third through ninth billion: United Nations, World Population in 2300 (medium scenario), 2003.
World Population Growth Through History Billions 12 11 2100 10 9 Modern Age Old 8 Iron Middle Bronze Stone Age New Stone Age Ages Age Age 7 Future 6 2000 5 4 1975 3 1950 2 1900 1 1800 Black Death — The Plague 2000 1+ million 7000 6000 5000 3000 1000 A.D. 4000 A.D. A.D. A.D. A.D. A.D. years B.C. B.C. B.C. B.C. B.C. B.C. B.C. 1 1000 2000 3000 4000 5000 Source: Population Reference Bureau; and United Nations, World Population Projections to 2100 (1998).
DemographicsApplying The Numbers Chapter #8 – Global Connections
World Population Patterns & Trends • When demographers examine the world’s population, they see FIVE major trends: • Large and Growing Larger • Growing Population Disparity • Declining Growth/Increasing Numbers • Changing Age Structure • Movement Towards The Cities
Population Density & Distribution Population Density – the average number of people living in a specific unit of land. Population Distribution – determines where those people live. There Are Two Population Density Types: • Arithmetic Population Density • Physiologic Population Density
Arithmetic Population Density • Refers to the exact number of people in a certain area of the land. • These statistics are always presented as number of people per square kilometers/miles. • This statistic provides you with a fairly accurate idea of how crowded a country is. • However, in many cases this statistic provides a false impression. Why?
Canada has an arithmetic population density of 3.3 per square kilometer. Total Population = 30,600,000 = 3.3 Total Land Area 9,220,970 km2 • 3.3 people/km2 would suggest Canada’s population is very dispersed; however we know that this is not the case. • The majority of Canada’s population lives in a narrow strip above the US border while the rest of the country is relatively empty.
The factors that tend to attract low population densities (Constraints) Extreme climate - too cold, hot, wet or dry Extreme relief - too high and too steep Extreme remoteness - places that are difficult to reach Infertile land
The factors that can produce a high population density (Opportunities) Moderate Climate Fertile farming land - many, small farms able to support a large population Mineral resources - mines produce jobs, and provide raw materials for other industries Low land - with gentle slopes or flat ground Good water supply Wealthier areas - people will move to where the jobs and money are found
Physiologic Population Density • Because of arithmetic inaccuracies Physiologic Population Density is also calculated. • Physiologic describes population density relative to the amount of cultivated land a country has. • Cultivated land represents an area of highly occupied land. • (Canada=64.3 people/km2) Total Population = 30,600,000 =64.3 Cultivated Land 455,000 km2
Population Distribution • Refers to the location of a population and how they have arranged themselves on the land. • Geographers try to understand why people live close together in certain areas of the country. • People settle where they can: a) Survive b) Prosper • The areas of greatest population concentration are known as heartlands.