Download
1 / 12
120 likes | 217 Views
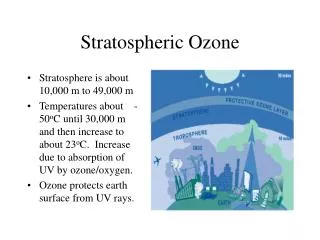
Asian and stratospheric influences on western U.S. ozone air quality . Arlene M. Fiore.

E N D
Asian and stratospheric influences on western U.S. ozone air quality Arlene M. Fiore Acknowledgments. Meiyun Lin (Princeton), VaishaliNaik (GFDL), Larry Horowitz (GFDL), Jacob Oberman (U WI), HaraldRieder (CU/LDEO), Libby Barnes (NOAA, CU/LDEO), Pat Dolwick (EPA OAQPS), Joe Pinto (EPA NCEA) AQAST4 Sacramento, CA November 29, 2012
Some challenges for WUS O3 air quality management Warming climate +in polluted regions [Jacob & Winner, 2009 review] + natural sources [recent reviews: Isaksen et al., 2009; Fiore et al., 2012] ? Transport pathways stratosphere Natural events e.g., stratospheric [Langford et al[2009]; fires [Jaffe & Wigder, 2012] lightning CH4 Rising Asian emissions [e.g., Jacob et al., 1999; Richter et al., 2005; Cooper et al., 2010] “Background Ozone” X Wildfire, biogenic Pacific Asia Western USA Need process-level understanding on daily to multi-decadal time scales Today’s talk: 1) Model estimates of background (TTP) 2) Developing space-based indicators for Asian + Strat. sources 3) Changing variability (emissions, climate warming)
Models differ in estimates of North American background (estimated by simulations with N. American anth. emissions set to zero) North American background (MDA8) O3 in model surface layer 2006 AM3 (~2°x2°) GEOS-Chem (½°x⅔°) AM3: More O3-strat + PBL-FT exchange? Spring (MAM) GC: More lightning NOx (~10x over SWUS; too high) Summer (JJA) ppb J. Oberman TTP PI: Fiore
Constraints on springtime background O3 from OMI and TES mid-tropospheric products (2006) Bias vssondessubtracted from retrievals as in Zhang et al., ACP, 2010 L. Zhang, Harvard • AM3 generally high; GEOS-Chem low • Implies that the models bracket the true background • Need to delve deeper into specific processes
Estimates of Asian and stratospheric influence on WUS surface ozone in spring • TOOL: GFDL AM3 chemistry-climate model [Donner et al., J. Clim. 2011] • ~50x50 km2 • Nudged to GFS winds • Fully coupled chemistry in the stratosphere and troposphere within a GCM Mean MDA8 O3 in surface air Asian: May-June 2010 Stratospheric (O3S): April-June 2010 O3(ppb) O3(ppb) 0 2 4 6 8 Tagged above e90 tropopause[Prather et al., 2011] + subjected to same loss processes as tropospheric O3. Base Simulation – Zero Asian anth. emissions • [Lin et al., JGR, 2012a] • [Lin et al., JGR, 2012b] Do they influence high-O3 events in populated regions?
Asian O3 pollution over S. CA: Trans-pacific transport + subsidence to lower troposphere GFDL AM3 Model Asian O3 Altitude (km a.s.l.) θ [K] Latitude (N S) along S CA [ppb] 0 10 20 30 AIRS CO columns May 4 May 6 May 8 Consistent with sonde and aircraft [Lin et al., JGR, 2012a] [1018 molecules cm-2] • Influence in surface air?
Asian pollution contributes to high-O3 events over S. CA in the GFDL AM3 model (~50 km2 resolution) ~50% of MDA8 O3 > 70ppbv would not have occurred without Asian O3 25th percentile • Asian emissions contribute ≤ 20% of total O3 (local influence dominates) • Highest Asian enhancements for total ozone in the 70-90 ppbv range • Lin et al., 2012a, JGR – publicity: AGU Editors’ Highlight, Science Shot, Nature News
Stratosphere-to-troposphere (STT) O3 transport influence on WUS high-O3 events Surface MDA8 O3, May 29 AIRS, May 25-29 M. Lin et al., JGR, 2012b Sonde O3,May 28 SH TH RY PS JT 300 hPa PV SN Altitude (km a.s.l.) Total column O3 [DU] AM3 O3S Would STT confound attainment of tighter standards in WUS? Are exceptional events accurately identified? North South 15 25 35 45 55 30 90 60 120 [ppb] 150 [ppb] • Potential for developing space-based indicators?
Developing space-based indicators of daily variability associated with Asian pollution and STT events Correlation coefficients of AM3 daily Asian or Stratospheric O3 sampled at a selected CASTNet site with AIRS products at each 1ºx1º grid AM3 O3S at Chiricahua, NM with AIRS 300 hPaO3 April-June 2011 AM3 Asian O3 at Grand Canyon NP with AIRS CO columns 2 days prior May-June, 2010 [Lin et al., 2012a] r 0.6 0.5 0.4 0.3 0.2 0.1 r 0 • Advanced warning of Asian/STT impacts on surface O3 episodes in WUS? • Site-specific “source” regions for characterizing exceptional events • Analysis of STT indicator for a full decade [M. Lin, AGU talk]
Quantifying extreme O3 events in probabilistic terms: Initial application to Eastern USA 1-year return O3 values at CASTNet measurement sites (Statistical methods from extreme value theory) 1988-1998 1999-2009 • Dramatic decreases in 1-year return levels following NOx SIP call Riederet al., in revision, Environ. Res. Lett. How might climate warming influence extreme pollution events? 83520601
Identifying key drivers of surface ozone variability: Jet location over Eastern N. America GFDL CM3Base+Climate warming (RCP4.5, WMGG only, +1.4K) Observations (CASTNET + MERRA reanalysis) Jets 2006-2015 2086-2095 Jet Peak in variability (σ) aligns with jet Mean MDA8, land only (ppb) Standard deviation (ppb) Jet shifts N with climate warming; σ increases to N of jet (and decreases to S) NO Emissions NOx emissions peak south of jet where mean MDA8 O3 highest (GFDL CM3 and CASTNET obs) • O3-Temp. correlation also follows jet; larger shifts with larger T change • Explore role of jet location in WUS (Asian, STT events) For more info, see Libby’s AGU poster Fri Afternoon: Barnes & Fiore, A53D-0171Hall A-C MosconeSouth 83520601
Take-away: Satellite products can indicate potential for contributions from transported “background” Ongoing analysis of potential for space-based indicators of stratospheric O3 enhancements • Indicate potential downwind influence • Public health alerts • Identify exceptional events • Quantitative estimates require models • Decadal planning: expect changes in a warming climate? OMI Total Column O3 OMI ~550-350 hPa O3 300 hPa PV [DU] [ppbv] Products from X. Liu, Harvard More information: Meiyun Lin’s AGU talk A14B-08 Mon 5:45 Moscone West 3004