Download
1 / 21
210 likes | 405 Views
Regional to hemispheric influences of AVOC and BVOC on ozone air quality. Arlene M. Fiore. Acknowledgments: Yuanyuan Fang, Larry Horowitz (NOAA GFDL) TF HTAP Modeling Team. Gordon Research Conference Biogenic Hydrocarbons & the Atmosphere Les Diablerets , Switzerland

E N D
Regional to hemispheric influences of AVOC and BVOC on ozone air quality Arlene M. Fiore Acknowledgments: Yuanyuan Fang, Larry Horowitz (NOAA GFDL) TF HTAP Modeling Team Gordon Research Conference Biogenic Hydrocarbons & the Atmosphere Les Diablerets, Switzerland May 27, 2010
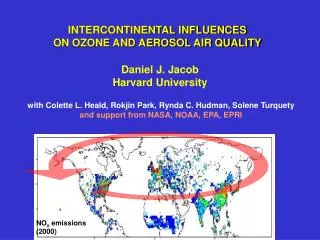
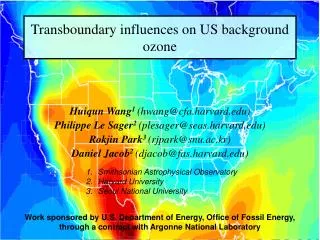
Evidence of intercontinental transport at northern midlatitudes: 2001 Asian dust event Clear Day April 16, 2001 Dust leaving Asian coast, April 2001 Reduced Visibility from Asian Dust over Glen Canyon, Arizona, USA Image c/o NASA SeaWiFS Project and ORBIMAGE • Intercontinental ozone transport is difficult (impossible?) to observe directly at surface [e.g., Derwent et al., 2003; Fiore et al., 2003; Goldstein et al., 2004; Jonson et al., 2005] • Estimates rely on models 3D Model Structure
CH3C(O)OONO2 O3 PAN O3, PAN lightning Two pathways for hemispheric O3 transport:direct export and PAN decomposition NOx+ BVOC, AVOC O3 Human activity Fires Biosphere OCEAN OCEAN CONTINENT CONTINENT 2. 1. Observational evidence for O3 production following PAN decomposition in subsiding Asian plumes [e.g., Heald et al., JGR, 2003; Hudman et al., JGR, 2004; Zhang et al., 2008; Fischer et al., 2010]
Multi-model effort to quantify & assess uncertainties in N. mid-latitude hemispheric O3 transport EMEP CASTNet EANET Task Force on Hemispheric Transport of Air Pollution (TF HTAP) to inform policy negotiations under CLRTAP BASE SIMULATION (21 models): horizontal resolution of 5°x5° or finer 2001 meteorology each group’s best estimate for 2001 emissions methane set to 1760 ppb SENSITIVITY SIMULATIONS (13-18 models): -20% regional anthrop. NOx, CO, NMVOC emissions, individually + all together (=16 simulations) TF HTAP, 2007, 2010; Sanderson et al., GRL, 2008; Shindell et al., ACP, 2008; Fiore et al., JGR, 2009, Reidmiller et al. ACP, 2009; Casper Anenberg et al., ES&T, 2009; Jonson et al., ACPD,2010
Multi-model mean captures obs in spring, when hemispheric transport at N. mid-latitudes peaks Monthly mean surface O3 EASTERN USA CENTRAL EUROPE INDIVIDUAL MODELS OBS (EMEP) MODEL ENS. MEAN Surface Ozone (ppb) OBS (CASTNet) Seasonal cycle captured over Europe Month of 2001 High bias over EUS in summer and early fall Pervasive model bias in surface O3 over the eastern United States: A role for isoprene?
Model ensemble annual mean decrease in surface O3from 20% reductions of regional anthrop. O3 precursors Foreign vs. “domestic” influence over NA: (1.64) Full range of 15 individual models NA “sum 3 foreign” ppbv EU “domestic” Source region: NA EU EA SA EU+EA+SA EA SA ppbv Fiore et al., JGR, 2009
Seasonality of surface ozone response over North America and Europe to -20% foreign anthrop. emissions Source region: SUM3 NA EAEUSA Receptor = NA Receptor = EU 15- MODEL MEAN SURFACE O3 DECREASE (PPBV) Spring max due to longer O3 lifetime, efficient transport [e.g., Wang et al., 1998; Wild and Akimoto, 2001; Stohl et al., 2002; TF HTAP 2007] Similar response to EU & EA emissions over NA Apr-Nov (varies by model) NA>EA>SA over EU (robust across models) Fiore et al., JGR, 2009
UNCERTAINTIES IN ESTIMATES: Surface O3 response to foreign anthrop. emissions varies widely across individual models Multi-model mean Individual models • No obvious correlation of strength of foreign influence with individual model biases relative to O3 observations [Fiore et al., JGR, 2009; Reidmiller et al., ACP 2009;Jonson et al, ACPD 2010 ] • Generally not due to model differences in anthropogenic emissions (one exception)
Strong sensitivity of exported EU O3 to large spread in EU NMVOC inventories (anthrop. NOx fairly similar across models) Annual mean surface O3 decrease over NA (ppb) from 20% decreases in anthrop. EU NMVOC Individual models EU Anthrop. NMVOC Emissions (Tg C) Fiore et al., JGR, 2009
What is the role of BVOC in hemispheric O3 transport? Percent of total NMVOC emissions multi-model mean values from HTAP study NON-ANTHROPOGENIC (mainly BVOC) ANTHROPOGENIC Rapidly evolving knowledge from lab and field studies [e.g., Lelieveld et al., 2008; Hofzumahaus et al., 2009; Paulot et al., 2009ab; Perring et al., 2009; Brown et al., 2009; and many others!] “the treatment of isoprene in global models can only be seen as a first order estimate at present, and points towards specific processes in need of focused future work” [von Kuhlmann et al., 2004]
Differences in isoprene emissions (and chemistry) contribute to inter-model variability in tropospheric O3 and PAN GEOS-Chem model 7000 6000 5000 4000 3000 2000 1000 0 Tropospheric O3 Production (Tg yr-1) Models used in ACCENT Older models with NMHC Older models w/o NMHC 0 100 200 300 400 500 600 700 Isoprene Emissions (Tg C yr-1) [Wild, ACP, 2007] Total NMVOC emissions (Tg C yr-1) [Wu et al., JGR, 2007]
Surface O3 response over North America (spatial average) to North American emission perturbations MOZART-2 (GFDL) model Interannual variations in NA isoprene emissions ~ 20-30% [Palmer et al. 2006] -20% NA anthrop. NOx+CO+NMVOC -20% NA anthrop. NOx -20% NA anthrop. NMVOC +20% NA isoprene O3 response to isoprene ~1/3 that to NOxin summer
PAN response at a European mountain site to regional precursor emission changes May peak in European anthrop. influence NA isoprene influence on PAN at European mountain site similar to that from NA or EU anth. emissions in summer
Surface O3 response over Europe (spatial average) to North American emission perturbations Variation across models? ACCMIP may address (global perturbations) -20% NA anthrop. NOx+CO+NMVOC -20% NA anthrop. NOx -20% NA anthrop. NMVOC +20% NA isoprene Surface ozone response over Europe (ppb) O3 response over EU to NA isoprene comparable to that to NA NOx in summer/fall; larger than NA AVOC
Is the O3 response to anthropogenic emission changes sensitive to NOxrecycling rates from isoprene nitrates? Isoprene nitrates O3 ISOPRENE + NOx Summer (JJA) surface O3 response to 20% decrease in NA anthro. emissions ? Summer(JJA) surface O3 change from 40% to 100% NOx recycling from isoprene nitrates 40% recycling (based on Horowitz et al., 2007) 100% recycling ppb ppb Change is more robust than the mean state
What is our understanding of how ozone air quality will respond to climate change? Modeled changes in summer mean of daily max 8-hour O3 (ppb; future climate – present climate) NE MW WC GC SE “These differences seem to result largely from variations in the simulated patterns of changes in key meteorological drivers... How isoprene nitrate chemistry is represented in the different modeling systems is an additional critical factor in the simulated O3 response to climate change” [Weaver et al., BAMS, 2009]
How will climate change affect BVOC emissions and ozone air quality? Surface O3 change due to isoprene response to +5K Temperature increase (500 to 940 Tg C yr-1) [Ito et al., JGR, 2009] Isoprene nitrate treatment affects model O3 response to climate through isoprene emission response 100% recycling of isoprene nitrates 0% recycling of isoprene nitrates ISOPRENE f (T, hv, LAI, CO2, drought? pollutant levels?) [e.g. Guenther et al., 2006; Rosenstiel et al., 2003; Arneth et al., 2007, 2008; Sitch et al., 2007] Abundance of uncertainties/unknowns, in both emissions and chemistry Species-specific emission rates
Potential for large impacts on future air quality via land-use changes [e.g., Wiedinmyer et al., 2006] Forest conversion to grasslands/crops decreases isoprene emissions [Chen et al., 2009; Lathiere et al., 2010] and affects air quality [Avise et al., 2009] PRESENT DAY (1990-1999) FUTURE (2045-2054) SRES A2 July isoprene emission capacity, normalized to 30°C (μg m-2 h-1) [Chen et al., ACP, 2009] Classify “biogenic” as “anthrop.” in future assessments of emission changes on air quality (+ climate)?
Concluding thoughts: Hemispheric influences of anthropogenic emissions and isoprene on O3 air quality • Model differences in EU AVOC inventories contribute to uncertainty in estimates for hemispheric O3 transport. • NA BVOC influence on EU free tropospheric PAN in summer is comparable to that from EU anthrop. emissions. • NA BVOC influence on EU surface O3 is comparable to that of NA anthrop. NOx in summer/fall. More attention needed on role of BVOC when assessing impacts of human activities on climate and air quality? Can differences across model ensembles be exploited to help guide observational sampling strategies? Potential for direct measurements of AVOC vs. BVOC influence on PAN? (C isotopes? and N isotopes for NOx?)
Monthly mean import sensitivities (surface O3 response to foreign vs. domestic emissions) SA fairly constant ~0.5 1.1 (EA), 0.7 (EU) during month with max response to foreign emissions 0.2-0.3 during month of max response to domestic emissions Fiore et al., JGR, 2009