Download
1 / 18
180 likes | 412 Views
Scalable Readout System Data Acquisition using LabVIEW III - Current status on June 2012. Riccardo de Asmundis INFN Napoli [ Certified LabVIEW Developer]. Remind : The LV Project for srs -DAQ. m MeGas chambers. “RD51-srs” LabVIEW Project. Program Structure.

E N D
Scalable Readout System Data AcquisitionusingLabVIEWIII - Currentstatus on June 2012 Riccardo de Asmundis INFN Napoli [CertifiedLabVIEW Developer]
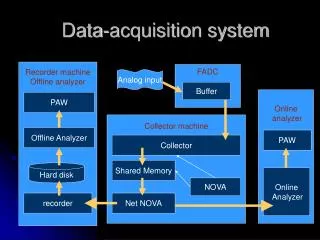
Remind:The LV Project for srs-DAQ mMeGas chambers “RD51-srs” LabVIEW Project
Program Structure • LabVIEW2011 Development System • ~ 40 modules developed (VIs) • ~ 12 custom data structures for storage & data handling • GUI (Graphical User Interface) as Main Panel • Monitor Panels for data flow checks • Strong parallel processing using multithreading and multicore features from the Machine and O.S. • Data emulation from acquired datafile in order to allow check & (partially) development also without srs
LabVIEWRD51-srs:several new featuresintroduced “Old” features & characteristics New features • UDP Connection • Incoming data monitor • Events filter based on data integrity • Traceable Events builder (Header and APV Contents generation) • Data file saving • Binary format U32-U16 • Compatible with the existing Analysis program • No zero suppression for the moment (format needed) • GUI (Graphical User Interface): • Separate panels for program settings • srs setups (Sorin’s Slow monitor) fully integrated • Online Data quality monitor • Several fetures… see following • Standalone (executable) version available
Subpanel access The main control panel (GUI) Running Processes control APV settings Data Files saving paths & Naming Error status UDP Parameters Online analysis settings RUN status display Internal queues occupacy
UDP Data Receiver UDP Codes data monitor UDP Data Receiver Formatted internal Data
Event recognition and formatting UDP data frame in graphical representation: channels in color, 1 sample per visible slot; IncomingEvent Formatted Event
Setting program parameters on separate windows • Example for File Saving Setting: • Choice of path and base for filename. • Example for Data Quality Monitor settling: • The user declares which channel (i.e. APV) must be displayed. • Several important parameters are included here (time and # of sampling, #of strips per channel, thresholds,…) • Example for APV slot settling: • The buttons placement reflects the Fec channels inputs. • The user declares here which slots (APV Channels) are to be used and which APV card is connected (Master/Slave or Both
Online Data Quality Monitor Most of these features have been developed on requests thanks to the experience in the Utilization of the software by Shikma Bressler (Weizmann Institute of Science). Presentation features Data Quality Features • Raw data view (incoming frames) • 2-D View of hitted strips or pads on the detector • 3-D View of channel vs. time charge recorded • Main projections: • amplitude vs. channel (strips) • Amplitude vs. time • Hold current event function for inspection • Online Efficiency and Multiplicity calculation based on separate thresholds • Total accumulated Charge and maximum detected charge histograms • Single channels charge histograms
In case the Chamber has pads instead of strips, different «Pads» views are available. Here an 8x8 pads view is shown. 3-D view of a significant Event: here view is reported as universal “Channel” from APV to fit to every detector configuration Online Data Monitor:some samples Ordinaryeventviewas Strip vs. Sample Index Ordinaryeventviewas Strip vs. Time
Example of Efficiencytracing and Multiplicitycalculation Online Data Monitor:some samples II 1: user sets a threshold for Efficiency calculation using the mouse and graphical cursor 1:Online EfficiencyCalculation 1: user sets a threshold for Multiplicity calculation using the mouse and graphical cursor 2:Online MultiplicityCalculation Amplitude vs. APV Channel view Amplitude vs. Sample index (i.e. time) view 2: the Efficiency is automatically calculated online all over the run 2: the Multiplicity of hitted strips or pads is shown here. # of chn. over thresh., central ch., higher and lower chns. are shown.
Noise and Baseline CombinedHistograms: totalcharge IndividualHistograms Online Data Monitor:otherstuffs
“Recorder” control Data file under inspection Datafile Dump • Saved files can be inspected thanks to a specific program. • Accessible from the Main Panel • Very interactive, “recorder” style • Graphical representation of data Event Header Event Dump
Standalone version • Ready • Easily portable • Standard, professional Installation Program • Needs LV 2011 Runtime Engine (can be embedded in the installation program)
Documentation • A Word «White Paper» is under writing • From details of program structure to data file format. • From GUI description and instruction to installation procedure • … to be completed !
Immediate further development • Fully integrate the srs_SlowMonitor as a transparent part in the GUI. • Use of simple, direct, smart setting windows • Leave the current Slow Monitor as “expert” view.
LabVIEWRD51-srs:cnclusions & perspectives • Smart • Not big in Files and Modules occupancy • Standalone version available (Pen Drive transportable, 166 MB with installer) • Flexible • Able to acquire a full Fec (16 APV). Extensible for more Fecs. • Portable • Easily portable on different machines and Operating System (standalone and installer are platform dependent) • Scalable • Relatively easy for developing of new features • Fast • Able to handle different parallel processes with fine priorities tuning • Compatible • Data file format compatible with existing analysis Available from now for daily laboratory usage or Test Beams. Looking for Beta tester !