Download
1 / 16
160 likes | 402 Views
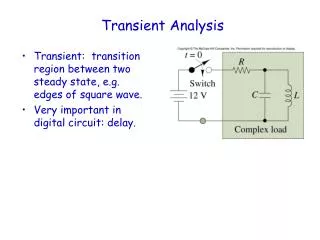
Pressure Transient Fourier Analysis Experiment by Student X Group Y ME 435L Winter 2007. Objectives. Calibrate a strain gage pressure transducer and compare to manufacturer’s calibration data Study transient response pressure fluctuations generated by rapid release of water from a raised tank

E N D
Pressure TransientFourier Analysis ExperimentbyStudent XGroup YME 435L Winter 2007 FOR ME 435L DEMOSTRATION PURPOSES ONLY
Objectives • Calibrate a strain gage pressure transducer and compare to manufacturer’s calibration data • Study transient response pressure fluctuations generated by rapid release of water from a raised tank • Create a computer generated curve fit of analog pressure transient curve using a Discrete Fourier Transform • Compare physical system to computer generated model • Find pressures at wt=120° and wt=180° FOR ME 435L DEMOSTRATION PURPOSES ONLY
Background Theory • Strain Gage Pressure Transducer • Strain gages bonded to diaphragm in Wheatstone Bridge configuration. • Pressure gradient causes deflection in diaphragm • Resistance in strain gages is proportional to diaphragm deflection FOR ME 435L DEMOSTRATION PURPOSES ONLY
Background Theory • Strain Gage Pressure Transducer (Continued) • Low mass and relative stiffness of diaphragm lead to a high natural frequency and quick response time • Well suited to transient measurements FOR ME 435L DEMOSTRATION PURPOSES ONLY
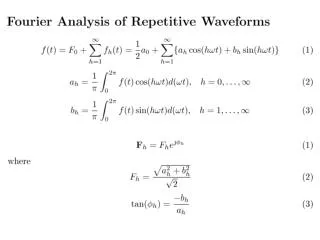
Background Theory • Fourier Analysis • Infinite expression of coefficients multiplied by sines and cosines to approximate a continuous, complex function • Fourier Transform • Method for decomposition of a measured signal (y(t)) into its amplitude-frequency components • Discrete Fourier Transform (DFT) • Approximation of the Fourier Transform for use with finite data sets • Fast Fourier Transform (FFT) • Algorithm to compute DFT quickly • Uses N log2 N operations as opposed to N2 in the DFT FOR ME 435L DEMOSTRATION PURPOSES ONLY
Fourier Analysis Theory FOR ME 435L DEMOSTRATION PURPOSES ONLY
Equipment • Viatran Corp. Model 119 Pressure Transducer • FSO Range: • 0-40” WCD • Static Sensitivity: • K = 100.54 +/- 15.3% mVDC / in WCD • Agilent Technologies HP34970A Data Acquisition / Switch Unit • Operating Range: • 0-10 VDC • Bias Error: • 0.0035% of Reading + 0.0005% of Range FOR ME 435L DEMOSTRATION PURPOSES ONLY
Equipment • Agilent Technologies HP35670A Dynamic Signal Analyzer • Range: • 90 dB • Accuracy • +/- 0.15dB • Operational Amplifier Bridge Signal Conditioning board • Gain potentiometer set to obtain 0.993 VDC at 10” WCD • Gain, G=120 FOR ME 435L DEMOSTRATION PURPOSES ONLY
Equipment • Water Supply Tank • Hole in bottom plugged by stopper • Ruler • Accuracy • +/- 0.0625” • PC with LABVIEW installed FOR ME 435L DEMOSTRATION PURPOSES ONLY
Pressure Transducer Calibration Curve FOR ME 435L DEMOSTRATION PURPOSES ONLY
Uncertainty Analysis BSE= 0.04” WCD BLIN= 0.16” WCD BHYS= 0.08” WCD BREP= 0.004” WCD BZB= 0.716” WCD FOR ME 435L DEMOSTRATION PURPOSES ONLY
Fourier Analysis ofPressure Transient Curve FOR ME 435L DEMOSTRATION PURPOSES ONLY
Fourier Analysis ofPressure Transient Curve FOR ME 435L DEMOSTRATION PURPOSES ONLY
Fourier Analysis ofPressure Transient Curve P(t) = 2.986 + 11.936 sin (πt ) + 3.282 sin (2πt + 1.512) + 1.482 sin (3πt - 1.557) + 1.064 sin (4πt - 1.408) + 0.577 sin (5πt - 1.164) + 0.577 sin (6πt + 1.152) + 0.656 sin (7πt - 1.198) + 0.318 sin (8πt - 1.222) + 0.239 sin (9πt - 0.246) + 0.328 sin (10πt + 0.653) + 0.537 sin (11πt + 1.241) + 0.477 sin (12πt - 0.931) + 0.129 sin (13πt + 0.766) + 0.368 sin (14πt + 0.436) + 0.517 sin (15πt + 1.57) + 0.338 sin (16πt - 0.349) + 0.169 sin (17πt - 0.733) + 0.338 sin (18πt + 0.960) + 0.348 sin (19πt - 1.132) + 0.129 sin (20πt + 0.069) + 0.149 sin (21πt + 0.155) + 0.288 sin (22πt - 1.247) + 0.239 sin (23πt - 0.944) + 0.050 sin (24πt + 0.724) + 0.199 sin (25πt + 0.91) + 0.159 sin (26πt + 1.479) + 0.119 sin (27πt - 1.136) + 0.030 sin (28πt - 1.217) + 0.099 sin (29πt + 0.973) + 0.139 sin (30πt + 1.533) + 0.099 sin (31πt - 1.139) + 0.050 sin (32πt + 1.529) + 0.090 sin (33πt + 1.187) + 0.109 sin (34πt + 1.546) + 0.080 sin (35πt + 1.299) + 0.050 sin (36πt + 1.57) + 0.070 sin (37πt + 1.294) + 0.090 sin (38πt + 1.516) + 0.070 sin (39πt -1.391) + 0.050 sin (40πt -1.528) [in. WCD] FOR ME 435L DEMOSTRATION PURPOSES ONLY
Fourier Analysis of Noise in Static Region FOR ME 435L DEMOSTRATION PURPOSES ONLY
Fourier Analysis of Noise in Static Region P(t) = 0.039 + 0.149 sin (100πt ) + 0.020 sin (200πt - 0.233) + 0.030 sin (300πt - 1.238) + 0.189 sin (400πt + 1.477) + 0.010 sin (500πt - 0.406) + 0.020 sin (600πt - 0.098) + 0.109 sin (700πt + 0.871) + 0.030 sin (800πt + 1.216) + 0.010 sin (900πt + 1.431) + 0.010 sin (1000πt + 1.045) + 0.010 sin (1100πt - 1.161) + 0.010 sin (1200πt + 0.139)+ 0.040 sin (1300πt + 0.507) + 0.020 sin (1400πt + 0.314) + 0.020 sin (1500πt + 0.015)+ 0.020 sin (1600πt - 1.327) + 0.010 sin (1700πt + 1.121) + 0.010 sin (1800πt - 0.81) + 0.010 sin (1900πt + 0.458) + 0.010 sin (2000πt + 0.078) [in. WCD] FOR ME 435L DEMOSTRATION PURPOSES ONLY