Download
1 / 11
110 likes | 186 Views
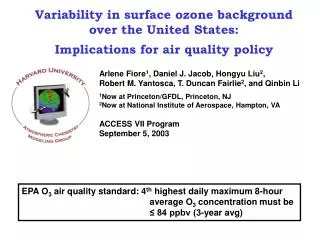
Key drivers of surface ozone variability, from WUS background to EUS extremes. Arlene M. Fiore.

E N D
Key drivers of surface ozone variability, from WUS background to EUS extremes Arlene M. Fiore Acknowledgments. O. Clifton (LDEO), M. Lin (Princeton), L. Murray (LDEO), L. Valin (LDEO), H. Rieder (U Graz), V. Naik & L. Horowitz (GFDL), J. Oberman (U WI), M. Gustin & R. Fine (U NV-Reno), A. Malone & R. Bamford (NV DEP), P. Dolwick (EPA OAQPS), T. Keating (EPA/OAR/OPAR), J. Pinto (EPA NCEA), G. Tonnesen (EPA Region 8) AQAST6 Rice University, Houston, TX January 15, 2014 83520601
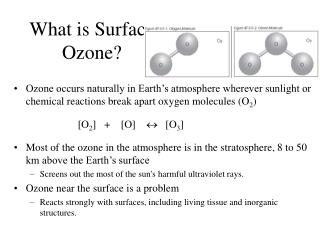
Total O3 in surface air over North America = “N. Amer. Background” +Anthropogenic regional O3 stratosphere Today’s talk: WUS: High background O3 events EUS: High total O3 events lightning Total ozone intercontinental transport + “North American Background” ozone Anthropogenic regional ozone O3 NMVOCs CO global methane NOx + Natural NOx, NMVOC X X Fires Biosphere Human activity Human activity Biosphere, Fires Ocean Foreign Continents North America
Estimates of Asian and stratospheric influence on U.S. surface ozone (MDA8) in spring Mean MDA8 O3 in surface air (GFDL AM3 model global strat-trop chemistry, 50 km2, nudged) Asian: May-June 2010 Stratospheric (O3S): April-June 2010 O3(ppb) O3(ppb) 6 0 2 4 8 Tagged above e90 tropopause[Prather et al., 2011] + subjected to same loss processes as tropospheric O3. Base Simulation – Zero Asian anth. emissions • Model indicates NV particularly susceptible; observations lacking • New 6-site network: Nevada Rural Ozone Initiative (NVROI) • led by M. Gustin, U NV-Reno [Gustin et al.; Fine et al., submitted] • [Lin et al., JGR, 2012a] • [Lin et al., JGR, 2012b]
Stratospheric ozone intrusions contribute to springtime high-O3 events observed at a new NVROI site OBS c/o M. Gustin, R. Fine AM3 model total surface O3 AM3 strat. O3 tracer R. Fine, U NV - Reno 4/15/12 5/1/12 6/1/12 7/1/12 7/31/12 M. Lin, Princeton/GFDL • Similar findings for other NVROI sites, consistent with earlier findings for Apr-June 2010 (based on satellite, sonde, aircraft, surface obs, AM3 [Lin et al., 2012ab])
Identifying process-level differences in model estimates of N. American Background via analysis of observed daily variations Observed high surface O3 event in Four Corners Region on May 28, 2006 GFDL AM3 OBSERVED (CASTNet) GEOS-Chem TOTAL MDA8 O3 Enhanced background coincides with enhanced total O3 (models + OBS) BACK- GROUND (N. Amer. anth. emis. set to zero in models) Fiore et al., submitted to Atmos. Environ. • Attributed to strat. intrusion (OMI total column O3 & OMI/MLS trop. O3) • Models frequently bracket obs(not limited to WUS spring), implying value in multi-model obs-constrained approach How best to extract useful information from biased models?
Over NE USA JJA, evaluate model processes in light of biases: GFDL CM3 generally captures surface O3 response to 25% decrease in regional NOx emissions (early 1990s to mid-2000s) GFDL CM3 Model (AM3 + full ocean & sea ice) Observed (CASTNet) Relative Frequency JJA MDA8 O3 (ppb) • Implies bias correction based on present-day observations can be applied to scenarios with NOx changes (RCPs for 21st C) • Caveat: Model response smaller than observed, worst at low tail Rieder et al., in prep
Bias correction (regional quantile mapping)for NE USA summertime high-O3 events Average (1988-2005) number of summer days with MDA8 O3 > 75 ppb (NAAQS) CM3 Historical simulation (3 ensemble-member mean) • Corrected CM3 simulation • (3 ensemble-member mean) 80 60 40 20 0 Rieder et al., in prep CASTNet sites (observations) • Maps raw model summertime MDA8 distribution (over all model cells in region) to observed (all sites in region) • Apply correction to 21st century projections with CM3 chemistry-climate model using Representative Concentration Pathways (RCPs)
Large NOx reductions offset climate penalty on O3extremes over the NE USA (moderate climate scenario: RCP4.5) # days in JJA with MDA8 O3 > 75 ppb 2006-2015 Change in # JJA days with MDA8 O3 > 75 ppb 2091-2100 RCP4.5 but 2005 O3 prec. emis. RCP4.5 CLIMATE CHANGE ONLY RCP4.5WMGG RCP4.5 CLIMATE + EMISSIONS RCP4.5: O3 prec. emis. change 20052100 NOx>80% over NE USA H. Rieder
Under RCPs, NE USA high-O3 events decrease; beware ‘penalty’ from rising methane (via background O3) 2005 to 2100 % change NE USA NOx Global NOx CH4 RCP8.5 RCP4.5 2006-2015 2016-2025 2026-2035 2036-2045 2046-2055 2056-2065 2066-2075 2076-2085 2086-2095 GFDL CM3 (uncorrected) MDA8 O3 (ppb) Rising CH4 in RCP8.5 partially offsets O3 decreases otherwise attained with regional NOx controls (RCP4.5) H. Rieder RCP4.5: Moderate warming Time Time RCP8.5: Extreme warming
Key drivers of surface ozone variability (from WUS background to EUS extremes) 2. Can push O3 above NAAQS over WUS [Lin et al., JGR, 2012ab] lightning 1. Drives much of springtime WUS variability in observed surface O3 [Lin et al., JGR, 2012b] stratosphere Asian pollution 3. Processes contributing most to differences in model estimates of North American Background [Fiore et al., submitted to AtmEnv] global methane Total ozone “North Amer. Background” ozone + • 4. Future EUS O3 extremes depend on regional climate change + global and regional emission changes • [Riederet al., in prep] • NE USA surface O3 seasonal cycle WUS background by end of 21st C?? • [CLIFTON POSTER] Constraints on oxidation from space?? [VALIN POSTER] Anthropogenic regional ozone X Natural NOx, NMVOC Biosphere, Human activity Fires North America
Atmospheric Chemistry Group at LDEO/CU Arlene Gus Luke Nora Olivia Lee Harald posters On the roof of our building following mid-Dec snowfall (missing from photo: undergraduate researcher Jean Guo)