Download
1 / 21
210 likes | 356 Views
Physical drivers of interannual variability in phytoplankton phenology. Harriet Cole 1 , Stephanie Henson 2 , Adrian Martin 2 , Andrew Yool 2 1 University of Southampton 2 National Oceanography Centre. Harriet.Cole@noc.soton.ac.uk. Outline.

E N D
Physical drivers of interannual variability in phytoplankton phenology Harriet Cole1, Stephanie Henson2, Adrian Martin2, Andrew Yool2 1University of Southampton 2 National Oceanography Centre Harriet.Cole@noc.soton.ac.uk
Outline What is phenology and why is seasonality important? Seasonality metric definition – bloom timing Basin-wide relationships between bloom timing and physical drivers Discussion – focus on subpolar North Atlantic and bloom initiation Future work harriet.cole@noc.soton.ac.uk
Phytoplankton bloom phenology Peak Initiation Termination Date of annually occurring features Defined in bloom timing metrics harriet.cole@noc.soton.ac.uk
Why seasonality is important • Overlap with peak abundance in grazers Match-mismatch hypothesis (Cushing, 1990) Time harriet.cole@noc.soton.ac.uk
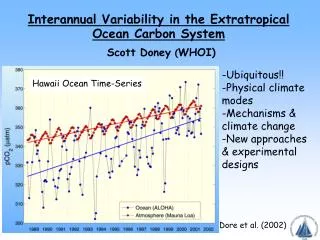
Why seasonality is important • Overlap with peak abundance in grazers • Carbon export – biological pump • Seasonal variability linked to magnitude of flux and fraction that is labile/refractory • Lutz et al. 2007 harriet.cole@noc.soton.ac.uk
Key Questions Meteorological conditions modulate bloom magnitude Subpolar North Atlantic - annual mean net heat flux, wind, TKE Spatially quite strong but not seen interannually (Follows and Dutkiewicz, 2002) Mean winter net heat flux and wind speed predictors for bloom initiation Irminger Basin (Henson et al. 2006) Does timing of change in physical environment influence bloom timing? – e.g. date the ML shoals/ML deepens Do physical processes drive all of bloom timing? harriet.cole@noc.soton.ac.uk
Critical depth vs. critical turbulence • Critical depth • Bloom starts when MLD becomes shallower than critical depth • Critical turbulence • Bloom starts when mixing rates become slower than phytoplankton growth and accumulation rates • Net heat flux becomes positive (Taylor and Ferrari, 2011) Huismann et al. 1999 harriet.cole@noc.soton.ac.uk
Bloom timing metrics GlobColour – satellite-derived chlorophyll Merges SeaWiFS, MODIS and MERIS 1x1 degree resolution, 8 day composites, 2002-2009 NASA Ocean Biogeochemical Model (NOBM) Assimilates SeaWiFS, 8 day composites, 2002-2007 – Nerger & Gregg, 2008 High fidelity to seasonal characteristics – Cole et al. 2012 No gaps – error on bloom initiation (30 days), peak (15 days) from gaps in satellite data • Initiation: rises 5% above annual median • Peak: maximum chlorophyll value • End: falls below 5% above annual median • Siegel et al., 2002 +5% Annual median harriet.cole@noc.soton.ac.uk
Physical data sources • MLD • T and S profiles (http://www.coriolis.eu.org/) • density change of 0.03 kg m-3 • Net heat flux • Satellite data + reanalysis products (NCEP/ECMWF) • (http://oaflux.whoi.edu/) • Irradiance • PAR data from MODIS (http://oceancolor.gsfc.nasa.gov/) • Average ML irradiance harriet.cole@noc.soton.ac.uk
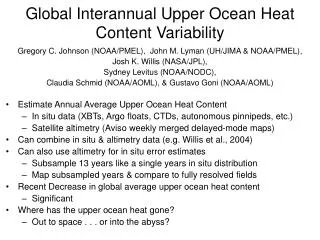
Average time series for North Atlantic harriet.cole@noc.soton.ac.uk
Physical timing metrics • Mixed layer depth • Timing of MLD max, MLD shoaling • PAR • ML PAR starts to increase, fastest increase, MLD shallower than euphotic zone depth • Net heat flux • Timing that NHF turns positive – Taylor and Ferrari, 2011 harriet.cole@noc.soton.ac.uk
Results • Bloom initiation more strongly correlated than peak and end with physical drivers • Basin-wide response seen in subpolar N. Atlantic • Patchy correlations in subpolar N. Pacific and S. Ocean harriet.cole@noc.soton.ac.uk
North Atlantic latitudinal gradients r=0.71 r=0.94 Bloom initiation r=0.69 r=0.76 Physical metric r=0.58 r=0.86 harriet.cole@noc.soton.ac.uk
North Atlantic interannual variability r=0.73 r=0.38 • 6 30°x10° boxes in North Atlantic. • Brackets indicate correlation coefficient is not statistically significant at the 95% confidence interval r=(0.36) r=0.45 (r=-0.013) (r=-0.12) harriet.cole@noc.soton.ac.uk
North Atlantic vs. North Pacific r=0.73 r=0.32 r=0.38 (r=0.03) r=0.45 (r=-0.11) harriet.cole@noc.soton.ac.uk
Correlation map of bloom initiation and NHF turns positive • Coherent patches harriet.cole@noc.soton.ac.uk
Discussion • Bloom initiation – strongest relationship with changes in physical environment • Suggests biological processes more important for peak and end timing • Nutrient limitation, grazing, etc. • NHF better than MLD for predicting start of bloom - critical turbulence vs. critical depth • Basin-wide response seen in N. Atlantic both spatially and interannually • Why different to N. Pacific and S. Ocean? • Large scales – strong correlation, small scales - noisy harriet.cole@noc.soton.ac.uk
Next steps Impact of global warming on the seasonal cycle of phytoplankton Climate change-driven trends in bloom timing using biogeochemical models Final year – submitting in October harriet.cole@noc.soton.ac.uk
Summary Seasonality metrics develop to estimate bloom timing Correlated with timing of changes in physical environment – spatially and interannually Bloom initiation more strongly correlated than peak and end of bloom NHF better predictor than MLD for onset of bloom Basin-wide relationships weaker in N. Pacific and S. Ocean harriet.cole@noc.soton.ac.uk
Thank you for listening! Questions? Acknowledgments GlobColour Project/ESA NOBM/Giovanni MODIS/NASA Coriolis Project WHOI OAflux Project Liége Colloquium – travel grant harriet.cole@noc.soton.ac.uk
References Cole, H., S. Henson, A. Martin and A. Yool (2012), Mind the gap: The impact of missing data on the calculation of phytoplankton phenology metrics, J. Geophys. Res., 117(C8), C08030, doi:10.1029/2012jc008249. Cushing, D. H. (1990), Plankton production and year-class strength in fish populations - an update of the match mismatch hypothesis, Adv. Mar. Biol., 26, 249-293. Follows, M. and S. Dutkiewicz (2002), Meteorological modulation of the North Atlantic spring bloom, Deep-Sea Research Part Ii-Topical Studies in Oceanography, 49(1-3), 321-344. Henson, S.A., I. Robinson, J.T. Allen and J.J. Waniek (2006), Effect of meteorological conditions on interannual variability in timing and magnitude of the spring bloom in the Irminger Basin, North Atlantic, Deep-Sea Research Part I-Oceanographic Research Papers, 53(10), 1601-1615, doi:10.1016/j.dsr.2006.07.009. Lutz, M.J., K. Caldeira, R.B. Dunbar and M.J. Behrenfeld (2007), Seasonal rhythms of net primary production and particulate organic carbon flux to depth describe the efficiency of biological pump in the global ocean, Journal of Geophysical Research-Oceans, 112(C10), C10011, doi:10.1029/2006JC003706. Nerger, L. and W.W. Gregg (2008), Improving assimilation of SeaWiFS data by the application of bias correction with a local SEIK filter, Journal of Marine Systems, 73(1-2), 87-102, doi:10.1016/j.jmarsys.2007.09.007. Siegel, D.A., S.C. Doney and J.A. Yoder (2002), The North Atlantic spring phytoplankton bloom and Sverdrup's critical depth hypothesis, Science, 296(5568), 730-733, doi: 10.1126/science.1069174. Taylor, J.R. and R. Ferrari (2011), Shutdown of turbulent convection as a new criterion for the onset of spring phytoplankton blooms, Limnology and Oceanography, 56(6), 2293-2307, doi:10.4319/lo.2011.56.6.2293. harriet.cole@noc.soton.ac.uk