Download
1 / 12
120 likes | 278 Views
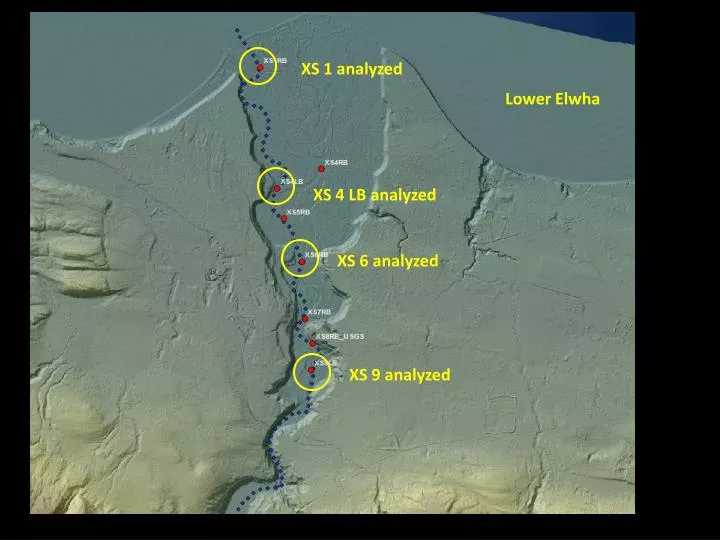
XS 1 analyzed. Lower Elwha. XS 4 LB analyzed. XS 6 analyzed. XS 9 analyzed. XS 11 analyzed. Middle Elwha. XS 13 and McD Gage analyzed. XS 16 analyzed. XS 19 analyzed. XS 20 analyzed. XS 24 analyzed.

E N D
XS 1 analyzed Lower Elwha XS 4 LB analyzed XS 6 analyzed XS 9 analyzed
XS 11 analyzed Middle Elwha XS 13 and McD Gage analyzed XS 16 analyzed XS 19 analyzed XS 20 analyzed XS 24 analyzed
Upper middle river; wave moves downstream quickly, and all XSs aggrade in late Oct/early Nov 2012. Peak of bedload wave propagates downstream, reaching McDonald Bridge gage in April 2013. Interestingly, XS 16 has now returned to pre-project elevation.
Stage gage XS13 and McDonald track each other, a good sign the analysis is valid. The XS11 gage, in the tail waters of Aldwell, sees incision from Aldwellsediment evacuation….pretty cool.
Things take a little longer to get started in lower river, but by Dec 1, 2012, those XSs that were going to aggrade had started to aggrade--even XS 1 by the coast. Aggradation is significant at XS 9 and XS 1; negligible at XS 4 and XS 6.
The aggradation was a little bit like a wave, but I’m struck by the nearly immediate responseof the start of aggradation for all XSs. Yes, there’s a wave of bedload that peaks at McD inApril 2013 and XS9 in May or June 2013, but all XSs were responding by Oct/Nov 2012.It’s like a blizzard that pushes sand down the entire river affecting everything at once. The cams show us that Mills reservoir start releasing sediment about Oct 25, 2012:
By Oct 31, 2012, Mills is in full-blown sediment belching mode….
We see a marked increase in sediment and discharge at the ESWI gage in Oct 2012….
But Oct 31, 2012, sees the first multi-day conveyor belt of SSC concentrations about 8,000 mg/L. I call this the “Sand Blast”, the point when the entire river corridor gets overwhelmed withsediment leading to widespread and nearly instantaneous geomorphic response…prettystinking cool!!
All the staff gages in the middle river are rising by the time the sand blast arrives….
Even the sharp incision at XS 11 in inchoate with the sand blast, which is cool in itself.Clearly, the river at XS11 were ready for Aldwellknickpoints to move upstream, but the sharp increase in river SSC increased river competence, promoted sedxport from Aldwell, andpropagated those knickpoints upstream past XS11….wow!
It took a little longer for the lower river to respond, but by Nov 11, 2012, XS 1 started to respond.


![As[Xs]](https://cdn2.slideserve.com/4174500/as-xs-dt.jpg)