Download
1 / 27
270 likes | 429 Views
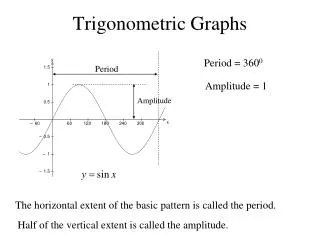
Trigonometric Graphs. What is to be learned?. How to draw and identify graphs with sine and cosine. Y = sinx. x. Sin x. -0.5. -0.87. -0.87. -0.5. 0. -1. 0.87. 0.5. 1. 0.5. 0.87. 0. 0. 1. 0.5. 0.

E N D
What is to be learned? • How to draw and identify graphs with sine and cosine
Y = sinx x Sin x -0.5 -0.87 -0.87 -0.5 0 -1 0.87 0.5 1 0.5 0.87 0 0
1 0.5 0 30 60 90 120 150 180 210 220 270 300 330 360 -0.5 -1
Y = sinx 1 0 180 360 270 90 -1 Maximum Value = 1 Minimum Value = -1
Y = cosx 1 0 180 360 270 90 -1 Maximum Value = 1 Minimum Value = -1
Y = 7sinx 7 0 180 360 270 90 -7 Maximum Value = 7 Minimum Value = -7
Y = 4cosx 4 0 180 360 270 90 -4 Maximum Value = 4 Minimum Value = -4
Y = - 8sinx 8 0 180 360 270 90 -8 “Opposite” to Sin x Maximum Value = 8 Minimum Value = -8
Trigonometric Graphs • Vital to know the basic shape of sin and cos • The same rules apply to each
Y = sinx 1 0 180 360 270 90 -1 Maximum Value = 1 Minimum Value = -1
Y = cosx 1 0 180 360 270 90 -1 Maximum Value = 1 Minimum Value = -1
Type y = A Sinx If there is a number in front, the graph is the same basic shape, but the limits change y = 11 sinx 11 0 180 360 270 90 -11 Max Value = 11 Min Value = -11
Y = -9sinx 9 0 180 360 270 90 -9 “Opposite” to Sin x
Y = sin x 1 0 540 450 180 360 270 90 -1 Cycle starts again Period of graph is 3600 Between 00 and 3600 there is 1 cycle Also applies to Y = cos x
Y = sin 2x 1 0 180 360 270 90 -1 Period of graph is 1800 There are 2 cycles between 00 and 3600
Combining these rules Draw y = 6sin2x Max 6 2 cycles Min -6 Period = 360 ÷ 2 = 1800 6 Y = 6sin 2x 0 180 360 270 90 -6
Y = 8cos4x Recognising Graph Max 8 4 cycles Cosine Min -8 8 0 180 360 270 90 -8
Type y = sin bx Number in front of x tells how many “cycles” there are y = Sin 3x has 3 cycles Length of each cycle is called the period. Period of y = sinx is 3600 Period of y = sin3x = 360 ÷ 3 = 1200 (up to 3600)
Combining our two rules Draw y = 8sin2x Max 8 2 cycles Min -8 Period = 360 ÷ 2 = 1800 8 Y = 8sin 2x 0 180 360 270 90 -8
Changing the Scale Nice for Drawing Graphs y = 6 Sin 3x Cycles? Period 3 360 ÷ 3 = 1200 6 0 60 120 90 30 -6
Not so nice for recognising graphs 8 0 300 600 450 150 -8 Period = 600 360 ÷ 60 = 6 No of Cycles? y = 8 cos 6x
Extra Trig Graph Rules Remember rules for y = (x – 3 )2 + 5 Same rules for trig graphs! 3 units to right Up 5
450 to right Y = 4cos (x – 450) 4 0 450 180 360 270 90 -4 Y = 4cosx
Y = 4cos (x – 450) 4 0 450 180 360 270 90 -4 Y = 4cosx always draw normal graph first as a guide
3 2 Y = sinx + 2 1 Y = sinx 0 180 360 270 90 -1
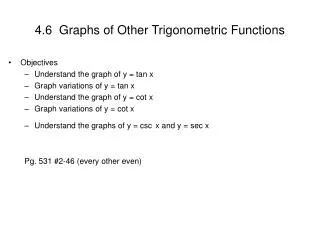
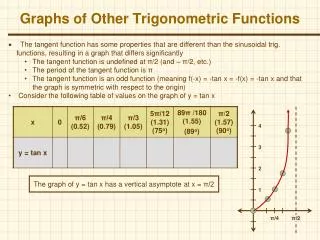
Goes to infinity What about y = Tanx ??? 0 180 360 270 90 Cycle complete Period is 1800 No Maximum (or minimum)