Download
1 / 29
300 likes | 547 Views
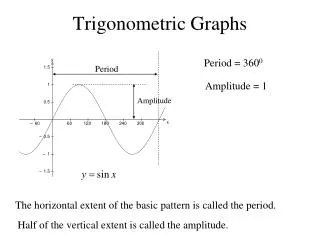
10.2 Translate and Reflect Trigonometric Graphs. How do you translate trigonometric graphs? How do you reflect trigonometric graphs?. p. 619. π. π. 2. 2. b. 4. h = 0. Amplitude:. a = 2. Horizontal shift:. π. 2. Period:. Vertical shift:. k = 3. =. =.

E N D
10.2 Translate and Reflect Trigonometric Graphs How do you translate trigonometric graphs? How do you reflect trigonometric graphs?
π π 2 2 b 4 h = 0 Amplitude: a = 2 Horizontal shift: π 2 Period: Vertical shift: k = 3 = = Graph a vertical translation Graphy = 2 sin 4x + 3. SOLUTION Identify the amplitude, period, horizontal shift, and vertical shift. STEP 1 STEP 2 Draw the midline of the graph, y = 3. Find the five key points. STEP 3
On y = k: (0, 0 + 3) = (0, 3); ( , 0 + 3) π = ( , 3); = ( , 3) ( , 0 + 3) 2 = ( , 5) Maximum: ( , 2 + 3) 3π ( , –2 + 3) 3π 8 Minimum: = ( , 1) π π π π π 8 2 8 4 4 8 Draw the graph through the key points. STEP 4
π π 2 2 b 2 h = 3π Amplitude: a = 5 Horizontal shift: Period: Vertical shift: π k = 0 = = Graph a horizontal translation Graphy = 5 cos 2(x – 3π ). SOLUTION Identify the amplitude, period, horizontal shift, and vertical shift. STEP 1 STEP 2 Draw the midline of the graph. Because k = 0, the midline is the x-axis. Find the five key points. STEP 3
13π 15π On y = k: = ( , 0); ( + 3π,0) 4 4 3π ( + 3π,0) 4 = ( , 0) = (3π, 5) Maximum: (0 + 3π, 5) (π+ 3π, 5) = (4π, 5) π π 7π 4 ( + 3π, –5) = ( , –5) Minimum: 2 2 Draw the graph through the key points. STEP 4
Ferris Wheel Suppose you are riding a Ferris wheel that turns for 180seconds. Your height h(in feet) above the ground at any time t (in seconds) can be modeled by the equation h = 85 sin (t – 10) + 90. π a. Graph your height above the ground as a function 20 of time. Graph a model for circular motion b. What are your maximum and minimum heights?
2π b. a. The amplitude is 85 and the period is = 40. The wheel turns = 4.5 times in 180 seconds, so the graph below shows 4.5 cycles. The five key points are (10, 90), (20, 175), (30, 90), (40, 5), and (50, 90). Your maximum height is 90 + 85 = 175feet and your minimum height is 90 – 85 = 5feet. π 20 40 180 SOLUTION
Graph the function. y =cosx + 4. 1. π π 2 2 1 b h = 0 Amplitude: 1 Horizontal shift: 2π = = Period: Vertical shift: k = 4 SOLUTION Identify the amplitude, period, horizontal shift, and vertical shift. STEP 1 STEP 2 Draw the midline of the graph. y = 4. Find the five key points. STEP 3
3π π On y = k: = ( , 4); ( 2π,0 +4) 2 2 3 4 ( 2π,0 + 4) = ( , 4) = (0,5) Maximum: (0 , 1 + 4) (2π,1 + 4) = (2π, 5) 1 1 4 ( 2π, –1 + 4) = (π , 3) Minimum: 2
Graph the function. y = 3 sin (x – ) 2. π 2 π π 2 2 1 b π h = Amplitude: 3 Horizontal shift: 2 2π = = Period: Vertical shift: k = 0 SOLUTION Identify the amplitude, period, horizontal shift, and vertical shift. STEP 1 Draw the midline of the graph.y = 0 Because k = 0, the midline is the x-axis. STEP 2 Find the five key points. STEP 3
π 3π 5π On y = k: = ( , 0); (0 + ,0) 2 2 2 π π π 1 1 2 4 2 2 2 = ( , 0) ( 2π + ,0) = ( , 0) ( 2π + ,0) π π π Maximum: ( 2π + , 3) = (π, 3) 3π 3 2 2 2 ( 2π + , –3) ( + , –3) 4 4 Minimum: = ( , –3) = 2π
Graph the function. f(x) sin (x + π) – 1 3. π π 2 2 b 1 – π h = Amplitude: 1 Horizontal shift: 2π = = Period: Vertical shift: k = –1 SOLUTION Identify the amplitude, period, horizontal shift, and vertical shift. STEP 1 Draw the midline of the graph. y = – 1. STEP 2 Find the five key points. STEP 3
On y = k: = (– π, – 1); (0 – π ,0 – 1 ) 1 π 1 2 4 2 = (0, –1) ( 2π –π ,–1) = (π , – 1) ( 2π – π ,0 – 1) π Maximum: ( 2π – π, 1 + 1) = (– ,0) 3 2 ( 2π – π, –1 –1) 4 Minimum: ( , – 2) =
How do you translate trigonometric graphs? The graphs of y = and , where a>0 and b>0 are horizontal translations h units and vertical translations k units of the graphs of and respectively, and have amplitude a, period , and midline • How do you reflect trigonometric graphs? In general, when , the graphs of and are the reflections of the graphs of respectively, in the midline
10.2 Assignment, day 1 Page 623, 3-21 odd
10.2 Translate and Reflect Trigonometric Graphs, day 3 • How do you translate trigonometric graphs? • How do you reflect trigonometric graphs?
Graphy = –2 sin (x – ). 2 3 2 π π 3 2 Amplitude: Horizontal shift: a = –2 = 2 h = 2 2π 2π = period : = 3π Vertical shift: k = 0 2 b Combine a translation and a reflection SOLUTION STEP 1 Identify the amplitude, period, horizontal shift, and vertical shift. Draw the midline of the graph. Because k = 0, the midline is the x-axis. STEP 2
5π So, ( , 2) becomes ( , –2 ) STEP 3 Find the five key points of y = –2 sin (x – ). 4 5π 9π 5π 3π 7π 3π π π π π π π ( + ,0) ( + ,–2) ( + ,2) On y = k: = ( , 0); (0 + ,0) = (2π, 0) 11π 2 4 4 2 4 4 2 2 2 2 2 2 and becomes . ( , 2) 4 = ( , 0) (3π+ ,0) π 2 = ( , 2) 3 2 Maximum: 11π 11π ( , –2) ( , –2) Minimum: = 4 4 STEP 4 Reflect the graph. Because a < 0, the graph is reflected in the midline y = 0. STEP 5 Draw the graph through the key points.
π Period: h = 0 Horizontal shift: k = 5 Vertical shift: Find the asymptotes and key points of y = –3 tanx + 5. Combine a translation and a reflection Graph y= –3tanx + 5. SOLUTION STEP 1 Identify the period, horizontal shift, and vertical shift. STEP 2 Draw the midline of the graph, y = 5. STEP 3
π Asymptotes: = x = x = ; – = 2 1 On y = k: = (0, 5) (0, 0 + 5) (– , –3 + 5) Halfway points: = π π (– , 2); 2 2 π π π π π π = π – 4 4 4 4 4 4 2 1 ( , 3 + 5) ( , 8) So, (– , 2) becomes π (– , 8) 4 ( , 8) and π becomes ( , 2) . 4 STEP 4 Reflect the graph. Because a < 0, the graph is reflected in the midline y = 5. STEP 5 Draw the graph through the key points.
Glass Elevator You are standing 120 feet from the base of a 260 foot building. You watch your friend go down the side of the building in a glass elevator. Write and graph a model that gives your friend’s distance d(in feet) from the top of the building as a function of the angle of elevation q . Model with a tangent function
opp 260 – d adj tanq = = 120 120 tanq 260 – d = 120 tan q– 260 – d = d –120 tan q+ 260 = SOLUTION Use a tangent function to write an equation relating dand q . Definition of tangent Multiply each side by 120. Subtract 260 from each side. Solve for d. The graph of d = –120 tanq + 260 is shown at the right.
π 2 y = – cos( x + ) Graph the function. 4. SOLUTION
5. y = – 3 sin x + 2 1 2 Graph the function. SOLUTION
6. f(x) = – tan 2 x – 1 Graph the function. SOLUTION
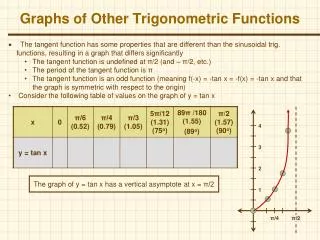
Graphing tangent functions using translations and reflections is similar to graphing sine and cosine functions. When a tangent function has a horizontal shift, the asymptotes also have a horizontal shift. , , and
10.2 Assignment, day 3 Page 623, 23-31 odd, 37-45 odd