Download
1 / 15
200 likes | 536 Views
4.6 Graphs of Other Trigonometric Functions. Objectives Understand the graph of y = tan x Graph variations of y = tan x Understand the graph of y = cot x Graph variations of y = cot x Understand the graphs of y = csc x and y = sec x Pg. 531 #2-46 (every other even). y = tan x.

E N D
4.6 Graphs of Other Trigonometric Functions • Objectives • Understand the graph of y = tan x • Graph variations of y = tan x • Understand the graph of y = cot x • Graph variations of y = cot x • Understand the graphs of y = cscx and y = sec x Pg. 531 #2-46 (every other even)
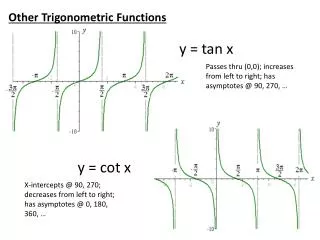
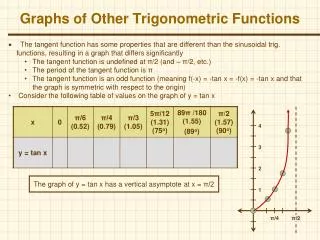
y = tan x • Going around the unit circle, where the y value is 0, (sin x = 0), the tangent is undefined. • At x = the graph of y = tan x has vertical asymptotes • x-intercepts where cos x = 0, x =
Characteristics of y = tan x • Period = • Domain: (all reals except odd multiples of • Range: (all reals) • Vertical asymptotes: odd multiples of • x – intercepts: all multiples of • Odd function (symmetric through the origin, quad I mirrors to quad III)
Graphing y = A tan (Bx – C) • Find two consecutive asymptotes by finding an interval containing one period. A pair of consecutive asymptotes occur at • and • Identify an x-intercept midway between the consecutive asymptotes. • Find the points on the graph at and of the way between the consecutive asymptotes. These points will have y-coordinates of –A and A. • Use steps 1-3 to graph one full period of the function. Add additional cycles to the left and right as needed.
Graphing y = cot x • Vertical asymptotes are where sin x = 0, (multiples of pi) • x-intercepts are where cos x = 0 (odd multiples of pi/2)
Graphing y = A cot (Bx-C) • Find two consecutive asymptotes by finding a pair. • One pair occurs at: Bx-C = 0 and Bx-C = π • Identify an x-intercept, midway between the consecutive asymptotes. • Find the points and of the way between the consecutive asymptotes. These points have y-coordinates of A and –A. • Use steps 1-3 to graph one full period of the function. Add additional cycles to the left and right as needed.
y = csc x • Reciprocal of y = sin x • Vertical tangents where sin x = 0 (x = integer multiples of pi) • Range: • Domain: all reals except integer multiples of pi • Graph on next slide Take notice of the blue boxes on page 527. The graphs demonstrate the close relationships between sine and cosecant graphs.
4. Use the graph of y = sin (x + π∕4) to obtain the graph of y = csc (x + π∕4)
y = sec x • Reciprocal of y = cos x • Vertical tangents where cos x = 0 (odd multiples of pi/2) • Range: • Domain: all reals except odd multiples of pi/2 • Graph next page Again, take notice of the blue boxes on page 527. The graphs demonstrate the close relationships between cosine and secant graphs.