Download
1 / 90
900 likes | 1.08k Views
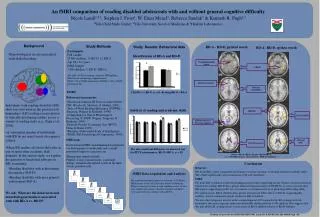
New directions in programming: Choosing frequency allocation tables for postlingually deaf CI users. Mario A. Svirsky Dept. of Otolaryngology New York University School of Medicine. Do postlingually deaf patients adapt completely to the standard frequency allocation tables?. Hypotheses.

E N D
New directions in programming: Choosing frequency allocation tables for postlingually deaf CI users Mario A. Svirsky Dept. of Otolaryngology New York University School of Medicine
Do postlingually deaf patients adapt completely to the standard frequency allocation tables?
Hypotheses 1) Human listeners can adapt to frequency-shifted auditory input, even when there’s spectral degradation 2) Some listeners may not adapt completely 3) Individual differences in the ability to adapt completely may have clinical implications and may be addressed by appropriate signal processing.
Four methods to measure adaptation to frequency tables 1) Pitch matching 2) Mathematical modeling of vowel identification 3) Perceptual vowel space 4) Self selection of “most intelligible” frequency table
Four methods to measure adaptation to frequency tables 1) Pitch matching 2) Mathematical modeling of vowel identification 3) Perceptual vowel space 4) Self selection of “most intelligible” frequency table
Method 1: Electroacoustic pitch matching Most apical electrode (#22), Nucleus device. Range=188-313 Hz Center=250 Hz Postlingually deaf adults with different amounts of post-implant experience. Data from three different laboratories.
Electroacoustic pitch matching- all electrodes • Six repetitions per electrode • Alternating stimulation to each ear • Acoustic frequency adjusted by the listener • Randomized starting frequency • Acoustic stimuli presented at comfortably loud level (when possible)
Chin-Tuan Tan Ben Guo (did not submit picture)
Bilateral pitch ranking with very different insertion depths- Case 1 • Two Advanced Bionics devices: normal insertion in left ear, only five active electrodes active in right ear (significant bone drillout). • Right ear had Ineraid device that was explanted; significant bone growth at the time of reimplantation. • Each electrode in the partial insertion ear was pitch ranked 2 to 5 times to each electrode in the full insertion ear. • Non-simultaneous presentation • Electrode in the full insertion ear was randomized. • Similar (standard) frequency tables in both ears. • 3 years right; 9 years left.
Matthew Fitzgerald 4 mm Left CI: Full Length 2.2 mm 479 Hz 1440 Hz 1.7 mm Right CI: Shallow 479 Hz 1440 Hz
Bilateral pitch ranking with very different insertion depths- Case 2 • Patient with residual hearing received Hybrid-S 10 mm electrode in the left ear. • Two years after the Hybrid implantation she lost residual hearing in both ears and was then implanted with a standard electrode (24 mm) in the right ear. • After loss of residual hearing and standard electrode implantation, both processors were programmed with the standard frequency table: 188-7938 Hz. • At the time of the Reiss et al. study (Ear and Hearing, 2011) she had 2-3 years of experience with these frequency tables. • She was also tested in our laboratory when she had six years of experience with the standard frequency tables in both ears.
Reiss et al. Ear & Hearing 2011 7.8 mm 3.9 mm 3760 Hz 325 Hz 3 mm 3760 Hz 325 Hz
CONCLUSIONS-METHOD 1Pitch matching • Pitch matching did not always line up with frequency allocation table • Electroacoustic pitch matching of most apical electrode, or all electrodes. • Pitch matching across CI ears with different insertion depths. • There is significant adaptation, but it is not always complete, despite years of experience.
Four methods to measure adaptation to frequency tables 1) Pitch matching 2) Mathematical modeling of vowel identification 3) Perceptual vowel space 4) Self selection of “most intelligible” frequency table
Method 2: Mathematical modeling of vowel identification Mathematical models of vowel confusion data allow us to measure the mismatch between: Places of maximal stimulation along the cochlea for a given vowel Places along the cochlea where the patient expects to be stimulated Qualitative description of Sagi et al (2010)
Fu et al. experiment • Three postlingually deaf adults users of SPEAK strategy. • 4-6 years of experience. • Three months of experience with new frequency table Table 1 Table 7 Table 9 CF0 75 120 150 CF1 175 280 350 CF2 275 440 550 CF3 375 600 750 CF4 475 760 950 CF5 575 920 1150 CF6 675 1080 1350 CF7 775 1240 1550 CF8 884 1414 1768 CF9 1015 1624 2031 CF10 1166 1866 2333 CF11 1340 2144 2680 CF12 1539 2463 3079 CF13 1785 2856 3571 CF14 2092 3347 4184 CF15 2451 3922 4903 CF16 2872 4595 5744 CF17 3365 5384 6730 CF18 3942 6308 7885 CF19 4619 7390 9238 CF20 5411 8658 10823
Sagi E, Fu QJ, Galvin JJ 3rd, Svirsky MA. JARO 2010 F2 11 10 9 8 7 6 5 F1 1 2 4 5 3
CONCLUSIONS-METHOD 2 Mathematical modeling • CI users show adaptation after they receive a modified frequency allocation table. • This adaptation may not be complete even after they reach asymptotic speech perception scores. • Correct pitch matching is necessary but not sufficient to achieve complete adaptation.
Four methods to measure adaptation to frequency tables 1) Pitch matching 2) Mathematical modeling of vowel identification 3) Perceptual vowel space 4) Self selection of “most intelligible” frequency table
Method 3: Perceptual vowel space A case of complete adaptation and a case of incomplete adaptation to standard frequency tables. Perceptual vowel space data from one of the asymmetric insertion patients
CONCLUSIONS-METHOD 3Perceptual vowel space • Some listeners adapt completely to the standard frequency tables; others don’t. • A similar statement can be made about different ears for the same listener.
Four methods to measure adaptation to frequency tables 1) Pitch matching 2) Mathematical modeling of vowel identification 3) Perceptual vowel space 4) Self selection of “most intelligible” frequency table
Current Clinical Practice • Is this optimal? For postlingually deaf patients, probably not. • We give every cochlear implant patient the same frequency-to-electrode map.
Cochleas come in different sizes Hardy (1938)- cochlear size can vary by as much as 40%. Stakhovskaya et al. (2007): SGN frequency map. 24 mm from the base 76 Hz in a 28 mm cochlea 1,020 Hz in a 42 mm cochlea 10 mm from the base 3,450 Hz 6,100 Hz
COCHLEAS COME IN DIFFERENT SIZES • Average basilar membrane length is about 35 mm, but it can range from 28 mm to 42 mm.
Evidence suggesting one size does not fit all (frequency tables) Skinner et al. (2002)- correlation between insertion depth and speech perception. Kos et al. (2007), Gani et al. (2007), Shapiro, Roland, Waltzman (2007)- overinsertion, electrode deactivation, too much bass.
Basic idea: power to the patient (or to the audiologist) Selection of frequency-to-electrode maps may be done in real time while the patient “turns a knob” to maximize the intelligibility of running speech. This real-time tool may allow: Faster comparison of different maps Better comparison