Download
1 / 17
170 likes | 318 Views
A Stream Flow Spike In a Heavily-Developed Area. An example of a stormwater surge caused by impermeable surfaces, measured at various points along the Olentangy River. The Problem. Rooftops and pavement are impermeable, meaning stormwater runs off instead of being absorbed into the ground.

E N D
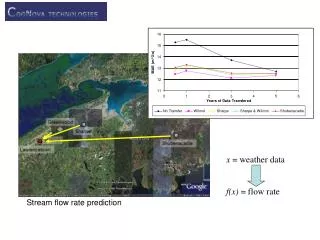
A Stream Flow SpikeIn a Heavily-Developed Area An example of a stormwater surge caused by impermeable surfaces, measured at various points along the Olentangy River
The Problem • Rooftops and pavement are impermeable, meaning stormwater runs off instead of being absorbed into the ground. • This stormwater very quickly drains to tributary streams, then to the rivers. • The rivers rise sharply with the added water, leading to erosion and potential flash flooding.
The Problem Before modern stormwater regulations, development did not have to include ways to slow the release of stormwater. Examples of this remain. Pavement and rooftops drain directly to the storm sewers and streams.
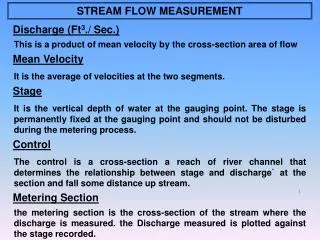
The Evidence The United States Geological Service (USGS) operates stream measuring stations at several points on our local streams. The data from these stations is available online. This presentation will interpret some of this data. Station #03226800, on the Olentangy at Wilson Bridge Road
Olentangy River Spikes We will look at water levels in the Olentangy, during one rain event of approximately 2 inches in 24 hours, at three locations: East of Marion, near St. Rt. 95,in a rural, lightly-developed area Below the Delaware Dam, where the water level is controlled by the dam operators At I-270 in Worthington, after the river has passed through the heavily-developed Rt. 23 corridor between Delaware and Columbus
Olentangy River Spikes The northernmost station is at Claridon, Ohio, just below where St. Rt. 95 crosses the river East of Marion. This station only records depth. A satellite view of the area shows a wooded riparian corridor passing through a mosaic of farm fields, without much pavement or other impermeable surfaces.
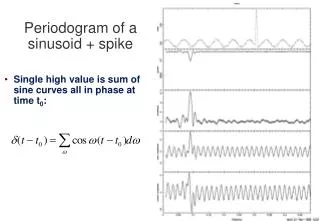
Olentangy River Spikes The station’s readings are fed to a USGS website which displays a graph. The graphs shown here are set to look back two days. The chart shows the river depth rose from slightly over one foot of depth, to seven feet, between October 22 and 24. Then the level slowly drops; note the smooth shape of the curve.
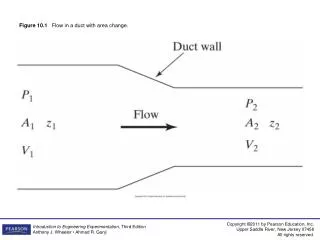
Olentangy River Spikes The next station is just below the Delaware Dam. There are no significant tributaries between the dam and the gauge, so the gauge shows almost exactly what the rate of release from the dam is. The US Army Corps of Engineers uses the reservoir to absorb the rush of water from upstream, for later release. But below this dam, there is no more control over the river level.
Olentangy River Spikes Readings taken here change very abruptly as the dam gates operate. The level raises only slightly during the rain event on October 22/23, but spikes sharply when the dam is opened later on October 23. The release rate is raised on the 24th, and again on the 25th.
Olentangy River Spikes The Delaware station also records flow in cubic feet per second (CFS). This is more accurate than simply measuring depth. 30 CFS to 700 CFS = 23x The volume climbs from 20 CFS to 30 CFS during the rain event on October 22, then climbs to 700 CFS when the dam is opened on October 23. The release rate is raised again on the 24th and the 25th.
Olentangy River Spikes The last station is just below I-270, in Worthington. It also measures stream height and volume. Here the river flows over artificial riffles because the bed was straightened for the construction of I-270. When the dam gates are open upstream, the riffles are immersed like this.
Olentangy River Spikes This station records the surge of runoff coming from impermeable surfaces between Delaware and Worthington. The level raises sharply from midnight to noon on October 23, but drops sharply back, even after the dam is opened later in the day. The dam releases on the 24th and 25th show as more gradual increases.
Olentangy River Spikes At midnight on the 23rd, the flow is approximately 60 CFS. Before noon, the volume spikes sharply to 1,900 CFS 60 CFS to 1,900 CFS = 31x The spike occurs before the dam is opened late on October 23, then quickly begins to drop. Then the dam releases on the 24th and 25th show as approximately 800 and 1,300 CFS.
Olentangy River Spikes Drawing a line to compare volumes at Delaware and Worthington, at noon on the 23rd, shows approximately 130 CFS at the dam while approximately 1,900 CFS flows by Worthington. That means there is more than 14x as much flow in Worthington, compared to below the dam. 130 CFS vs. 1,900 CFS = 14.6x 130 CFS 1900 CFS This does not account for the time required for the dam release to reach Worthington.
Some Solutions • Stormwater retention ponds can capture sudden downpours from rooftops and pavement, and release the water more gradually.They can also capture floating litter before it enters streams.
Some Solutions • Downspouts can be disconnected, to drain locally instead of draining to storm sewers and streams. This example bypasses the old black pipe to the curb, to run to the rear garden.
Some Solutions • Rain gardens and green roofs can absorb rainfall while providing attractive garden space, and habitat for wildlife. This rain garden is at the ODNR Division of Wildlife building on Dublin Road. END