Download

1 / 94
940 likes | 1.07k Views
The Human Population and Urbanization. Chapter 6. Section 6-1. How Many people can the earth support?. Human population growth continues but it is unevenly distributed.

E N D
The Human Population and Urbanization Chapter 6
Section 6-1 How Many people can the earth support?
Human population growth continues but it is unevenly distributed • For most of history, the human population grew slowly, but has been growing exponentially for the past 200 years. Reasons for this increase in growth rate include: • Humans have expanded into almost all of the planet’s climate zones and habitats. • The emergence of early and modern agriculture allowed us to grow more food for each unit of land area farmed. • Death rates dropped sharply because of improved sanitation and health care.
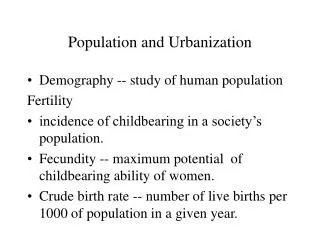
Human population growth continues but it is unevenly distributed • The rate of population growth has slowed, but the world’s population is still growing at a rate that added about 83 million people during 2011. • Geographically, growth is unevenly distributed. • About 1% of the 83 million new arrivals on the planet in 2011 were added to the world’s more-developed countries • The other 99% were added to the world’s middle- and low-income, less-developed countries. At least 95% of the 2.6 billion people likely to be added to the world’s population between 2011 and 2050 will end up in the least-developed countries.
2.5 2.0 1.5 Average annual global growth rate (percent) 1.0 0.5 0.0 1950 1970 1990 2010 2030 2050 Year Fig. 6-2, p. 97
Human population growth continues but it is unevenly distributed • Cultural carrying capacity isthe maximum number of people who could live in reasonable freedom and comfort indefinitely, without decreasing the ability of the earth to sustain future generations.
Section 6-2 What factors influence the size of the human population?
The human population can grow, decline, or remain fairly stable • Birth rate, or crude birth rate, is the number of live births per 1,000 people in a population in a given year. • Death rate, or crude death rate, is the number of deaths per 1,000 people in a population in a given year. • Population change of an area = (births + immigration) - (deaths + emigration)
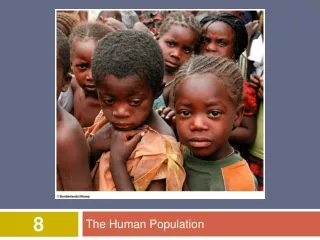
Women are having fewer babies but not few enough to stabilize the world’s population • The total fertility rate (TFR) is the average number of children born to women in a population during their reproductive years. • Between 1955 and 2011, the average global lifetime number of births of live babies per woman dropped from 5 to 2.5. • A TFR of 2.1 will eventually halt the world’s population growth.
4.0 3.5 3.0 Births per woman 2.5 2.1 2.0 1.5 Baby boom (1946–64) Replacement level 1.0 0.5 0 1920 1930 1940 1950 1960 1970 1980 1990 2000 2010 Year Fig. 6-3, p. 98
47 years Life expectancy 77 years Married women working outside the home 8% 81% High school graduates 15% 83% Homes with flush toilets 10% 98% Homes with electricity 2% 99% People living in suburbs 10% 52% 1900 Hourly manufacturing job wage 2000 $3 $15 Homicides per 100,000 people 1.2 5.8 Fig. 6-4, p. 99
Several factors affect birth rates and fertility rates • A particular country’s average birth rate and TFR can be affected by: • The importance of children as a part of the labor force. • The cost of raising and educating children. • The availability of, or lack of, private and public pension systems. • Urbanization.
Several factors affect birth rates and fertility rates • The educational and employment opportunities available for women. • The average age at marriage. • The availability of legal abortions. • The availability of reliable birth control methods. • Religious beliefs, traditions, and cultural norms.
Several factors affect death rates • People started living longer and fewer infants died because of increased food supplies and distribution, better nutrition, medical advances, improved sanitation, life expectancy, married women working, and safer water supplies. • Two useful indicators of the overall health of people in a country or region are life expectancy and infant mortality rate • The average global life expectancy increased from 48 years in 1955 to 69 years in 2011. Between 1900 and 2011, the average global life expectancy in the United States increased from 47 years to 78 years.
Several factors affect death rates • Infant mortality is a measure of a society’s quality of life because it reflects the general level of nutrition and health care. A high infant mortality rate can results from insufficient food (undernutrition), poor nutrition (malnutrition), and a high incidence of infectious disease, which is exacerbated by under- or malnutrition. • While infant mortality rates in more-developed and less-developed countries have declined dramatically since 1965, more than 4 million infants die during their first year of life.
Several factors affect death rates • The U.S. ranks 54th in the world in infant mortality rates due to: • inadequate health care for poor women during pregnancy and for their babies after birth • drug addiction among pregnant women • a high teenage pregnancy rate
Migration affects an area’s population size • Migration is the movement of people into (immigration) and out of (emigration) specific geographic areas. • Most people who migrate from one country to another are seeking jobs. • Religious persecution, ethnic conflicts, political oppression, wars, and certain types of environmental degradation are also factors. • Environmental refugees are people who migrate due to environmental degradation such as soil erosion and water and food shortages. One UN study estimated that a million people are added to this category every year.
CASE STUDY: The United States: A Nation of Immigrants • Since 1820, the United States has admitted almost twice as many immigrants and refugees as all other countries combined. • Legal and illegal immigration account for about 36% of the country’s annual population growth. • Between 1820 and 1960, most legal immigrants to the United States came from Europe. Since 1960, most have come from Latin America and Asia. Hispanics are projected to make up 30% of the U.S. population by 2050.
CASE STUDY: The United States: A Nation of Immigrants • There is controversy over reducing legal immigration to the U.S. • Proponents of reducing immigration say it would help stabilize population size and reduce the country’s enormous environmental impact. • Those against say it would diminish the role of the U.S. as a land of opportunity and take away from cultural diversity and innovation. Most immigrants and their descendants start new businesses and create jobs. Many immigrants take menial and low-paying jobs that most other Americans shun.
CASE STUDY: The United States: A Nation of Immigrants • There were an estimated 11 million illegal immigrants in the United States in 2011. There is controversy over what to do about illegal immigration. • Some want to deport all illegal immigrants. • Others want to set up programs that allow illegal immigrants to remain in the country as long as they are working towards citizenship.
2,000 1,800 1,600 1907 1,400 1914 New laws restrict immigration 1,200 Number of legal immigrants (thousands) 1,000 800 Great Depression 600 400 200 0 1820 1840 1860 1880 1900 1920 1940 1960 1980 2000 2010 Year Fig. 6-6, p. 101
Section 6-3 How does a population’s age structure affect its growth or decline?
A population’s age structure helps us to make projections • Age structure is the numbers or percentages of males and females in young, middle, and older age groups in a given population. • Population age-structure diagrams are made by plotting the percentages or numbers of males and females in the total population in each of three age categories: • Prereproductive (0–14): normally too young to have children. • Reproductive (15–44): normally able to have children. • Postreproductive (45+): normally too old to have children.
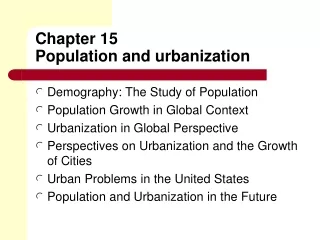
A population’s age structure helps us to make projections • Demographic momentum is rapid population growth in a country that has a large percentage of people younger than 15, and happens when a large number of girls enter their prime reproductive years. • 1.8 billion people will move into their reproductive years by 2025. • Most future human population growth will take place in less-developed countries due to their population age structure. • The global population of seniors (age 65 and older) is increasing due to declining birth rates and medical advances that have extended life spans.
Less-developed Countries More-developed Countries Male Female Male Female Male Female Male Female Expanding Rapidly Guatemala, Nigeria Saudi Arabia Expanding Slowly United States Australia, China Stable Japan, Italy Greece Declining Germany, Bulgaria Russia Prereproductive ages 0–14 Reproductive ages 15–44 Postreproductive ages 45–85+ Fig. 6-7, p. 102
CASE STUDY: The American baby boom • Added 79 million people to the U.S. population1946-1964. • The large numbers of baby boomers have strongly influenced the U.S. economy. First they created a youth market and are now creating the late middle age and senior markets. • As the baby boomers turn 65, the number of seniors will grow sharply through 2030. This process has been called the graying of America. • As the number of working adults declines in proportion to the number of seniors, so will the tax revenues necessary for supporting the growing senior population.
Populations made up mostly of older people can decline rapidly • Japan has the world’s highest % of elderly people and the world’s lowest % of young people. • Due to its discouragement of immigration, it may face a bleak economic future. • The average age of China’s population is increasing at one of the fastest rates ever recorded. This could lead to a declining work force, higher wages for workers, limited funds for supporting continued economic development, and fewer children and grandchildren to care for the growing number of elderly people.
Populations can decline from a rising death rate: the AIDS tragedy • Between 1981 and 2010, AIDS killed more than 29 million people, and it takes about 2 million more lives each year (22,000 in the United States). • AIDS kills many young adults and leaves many children orphaned, causing a change in the young-adult age structure of a country. This causes a sharp drop in average life expectancy, especially in several African countries where 15–26% of the adult population is infected with HIV. • AIDS can cause a pandemic loss of productive young adult workers and trained personnel.
Some Problems with Rapid Population Decline Can threaten economic growth Labor shortages Less government revenues with fewer workers Less entrepreneurship and new business formation Less likelihood for new technology development Increasing public deficits to fund higher pension and health-care costs Pensions may be cut and retirement age increased Fig. 6-9, p. 103
Two projected age structures for Botswana’s population in 2020
100+ 95–99 90–94 85–89 80–84 75–79 70–74 65–69 60–64 55–59 50–54 45–49 40–44 35–39 30–34 25–29 20–24 15–19 10–14 5–9 0–4 Males Females Age 120 100 80 60 40 20 0 20 40 60 80 100 120 Population (thousands) With AIDS Without AIDS Fig. 6-10, p. 104
Section 6-4 How can we slow human population growth?
There are three effective ways to slow population growth • The three most effective ways to slow or stop population growth are: • Reduce poverty • Elevate the status of women • Encourage family planning and reproductive health care.
Stage 1 Preindustrial Stage 2 Transitional Stage 3 Industrial Stage 4 Postindustrial Population grows very slowly because of a high birth rate (to compensate for high infant mortality) and a high death rate Population grows rapidly because birth rates are high and death rates drop because of improved food production and health Population growth slows as both birth and death rates drop because of improved Population growth levels off and then declines as birth rates equal and then fall below death rates 80 70 Birth rate and death rate (number per 1,000 per year) Total population food production, health, and education 60 Birth rate 50 40 30 Death rate 20 10 0 Low Increasing Very high Decreasing Low Zero Negative Growth rate over time Fig. 6-11, p. 105
Promote economic development • As countries become industrialized and economically developed, their populations tend to grow more slowly. This demographic transition has four phases: • Preindustrial • Transitional • Industrial • Postindustrial
Promote economic development • Less-developed countries may transition to slower growth if modern technology can raise per capita incomes by bringing economic development and family planning. • Rapid population growth, extreme poverty, and increasing environmental degradation in some low-income less-developed countries—especially in Africa—could leave these countries stuck in stage 2 of the demographic transition.
Empowering women can slow population growth • Women tend to have fewer children if they are educated, have the ability to control their own fertility, hold a paying job outside the home, and live in societies that do not suppress their rights. • Women account for 66% of all hours worked but receive only 10%of the world’s income and own just 2% of the world’s land. • Women make up 70% of the world’s poor and 64% of its 800 million illiterate adults. • Poor women who cannot read often have an average of 5–7 children, compared to 2 or fewer children in societies where almost all women can read.
Promote family planning • Family planning provides educational and clinical services that help couples choose how many children to have and when to have them. • Successes of family planning: • Without family planning programs that began in the 1970s, the world’s population would be about 8.5 billion instead of the current 7 billion. • Family planning has reduced the number of abortions performed each year and decreased the numbers of mothers and fetuses dying during pregnancy.
Promote family planning • Problems that have hindered success in some countries: • 42% of all pregnancies in less-developed countries are unplanned and 26% end with abortion. • An estimated 201 million couples in less-developed countries want to limit their number of children, but lack access to family planning services.
CASE STUDY: Slowing Population Growth in India • For over 50 years, India has tried to control its population growth with only modest success. • Two factors help account for larger families in India. • Most poor couples believe they need several children to work and care for them in old age. • The strong cultural preference for male children means that some couples keep having children until they produce one or more boys. • The result: even though 9/10 Indian couples have access to at least one modern birth control method, only 48% actually use one.