Download
1 / 55
580 likes | 881 Views
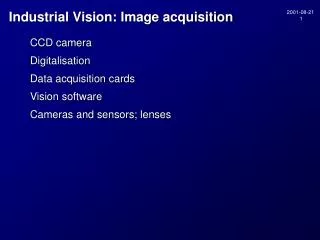
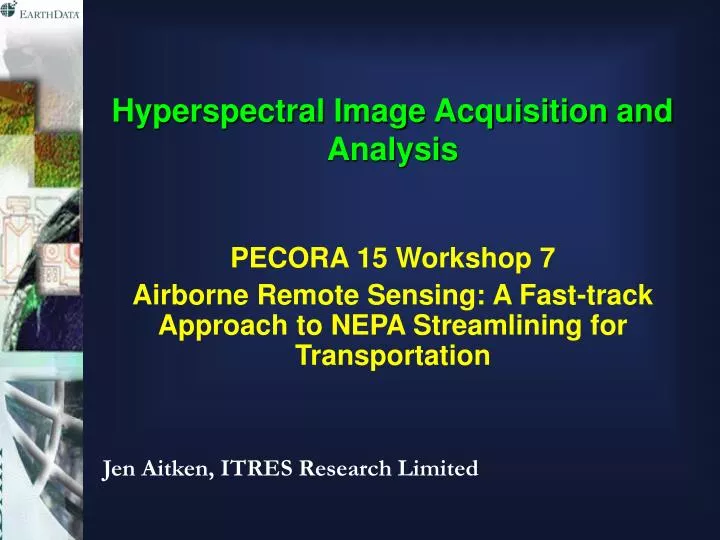
Hyperspectral Image Acquisition and Analysis. PECORA 15 Workshop 7 Airborne Remote Sensing: A Fast-track Approach to NEPA Streamlining for Transportation. Jen Aitken, ITRES Research Limited. CASI Hyperspectral and Lidar DEM. Presentation Outline. Project description Why hyperspectral?

E N D
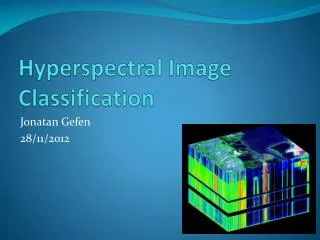
Hyperspectral Image Acquisition and Analysis PECORA 15 Workshop 7 Airborne Remote Sensing: A Fast-track Approach to NEPA Streamlining for Transportation Jen Aitken, ITRES Research Limited
Presentation Outline • Project description • Why hyperspectral? • Casi image acquisition • Creation of image map • Analysis of hyperspectral imagery to produce wetland classification - validation & verification • Conclusions
Project Objectives • Need to know location and extent of wetlands within a future transportation corridor • Acquire high spatial and spectral resolution imagery for semi rural area south east of High Point, NC • Produce thematic vegetation map highlighting potential wetlands • Combine imagery with topography from lidar
Project design Airborne Data Collection Data Processing / Data Fusion Analysis / Feature Extraction Validation & Verification Ground-truth (spectral, biology) Sensor / data fusion radiometric, atmospheric, mosaic CASI & GPS/IMU (hyperspectral) Spectral Classifications AeroScan LIDAR (lidar) DEM (bare earth/canopy) PRODUCTS Wetlands & land cover classifications
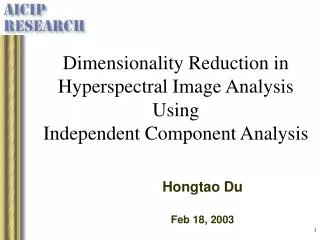
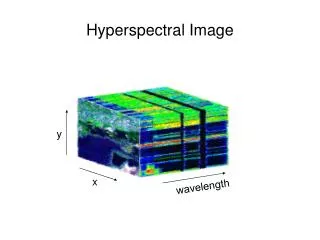
Why hyperspectral? • Many narrow spectral bands offers the ability to separate community level (and species) land cover features. • Hyperspectral provides subtle spectral signatures or curves of terrestrial targets. • Using hyperspectral makes it easier to ‘unmix’ pixels, thus improving confidence in classification results.
Why hyperspectral? The use of only a few spectral bands reduces discrimination capabilities and can create more confusion/uncertainty in the final classification
Why hyperspectral? The use of many spectral bands allows for detailed discrimination of features
48 Spectral bands: Iowa 2002 The use of many spectral bands allows for detailed discrimination of features
Hyperspectral vs. Satellite The use of many spectral bands allows for detailed discrimination of features
Why hyperspectral? CASI False color IR True color Simulated CIR
Project Area To High Point
CASI mosaics of DOT project area Spatial res: 1m # Spectral bands: 14 Red = 740 nm Green = 710 nm Blue = 550 nm
CASI 60cm Subarea • Eleven spectral bands. • 9 square kilometers.
CASI Data Acquisition • Project area approximately 5 km x 18 km. • Thirteen flight lines flown at one meter resolution (headings 330° and 150°, altitude 3150 ft. ASL). • Fourteen spectral bands from 430 nm to 878 nm. • Bandwidth: 15 nm (blue band 40 nm). • Subarea imaged at 60 cm, 11 bands. • Three hours to acquire data.
CASI Standard Processing • Image data radiometrically corrected to standard radiance units (SRU’s). • Imagery combined with GPS / IMU data and geometrically corrected into five mosaics covering project area. • Removal of atmosphere from image data, production of reflectance measurements. Radiometric Corrections Atmospheric Corrections Geometric Corrections
Spatial Accuracy Assessment An independent spatial accuracy assessment was performed comparing image coordinates with 31 surveyed ground control points. • TEST 1 X-coordinate (m) Y-coordinate (m) • Mean -0.648 -0.875 • Std Dev. 0.843 1.018 • RMSE 1.055 1.372 • TEST 2 X-coordinate (m) Y-coordinate (m) • Mean -0.878 -0.346 • Std Dev. 0.843 1.049 • RMSE 1.190 1.097
Keys to Successful Classification • Radiometric integrity of the imagery and the quality of the ground truth. • Precision geometric corrections to identify ground truth sites in the imagery. Also allows for sensor/data fusion to improve classification results. • Hyperspectral bandset. • Ground truth surveys by wetland biologist. • Calibration, validation & verification • Addition of digital elevation data and hydric soils.
Ground truth, validation & verification • Field visit 1 • GPS, vegetation type, drainage, soil type • This information used to calibrate the spectral libraries (control) • Analysis performed to produce preliminary classifications • Field visit 2 • validate classification results (test) • Finalize spectral library and apply analysis
Wetland Criteria • In order to be considered a wetland, an area must meet three criteria: • Drainage • Vegetation • Hydric Soils • “False wetland” sites may meet one or two of these criteria, but not all three.
Spectral Library Generation • Ground truth sites plotted on casi image mosaics. • Noise reduction of imagery in ENVI software (MNF and PPI procedures). • Spectrally pure pixels isolated in the imagery which coincide with ground truth sites. • Reflectance values for each band are extracted from pure pixels to create spectral signature.
Spectral Signatures of Vegetation Near infrared reflectance Chlorophyll absorption Chlorophyll scattering
Spectral Signatures of Water Bodies • Reflectance determined by water content (sediments, vegetation, organic and inorganic material) Vegetation content Sediment Clear water
Wetland Vegetation Classification • 32 spectral signatures for vegetation in the spectral library • Seven thematic categories based on NWI Classification Scheme: • Tree/shrub • Bare soil • Dense grass and Sparse grass • Obligate wetland species • Facultative wetland species • Willow
Site 10, Two natural springs in grazed field True color with lidar overlay (left) Classified image (right). Red = Obligate wetland
Site 7, narrow wetland drainage under mature tree canopy. This type of wetland can not be classified in casi imagery collected in mid summer. However, LIDAR provided information re drainage and depressions.
Site 7, Treed Wetland Surveyed wetland under tree canopy Potential associated wetland indicated by drainage and casi classification
Classification Accuracy Assessment, Original Ground Truth Sites • Twelve sites, ten wetland, two “false wetland”, four sites with tree cover. • Total accuracy of 12 sites: 7 of 12 = 58% • Accuracy of wetland sites: 6 of 10 = 60% • Accuracy of non treed sites, wetland and non wetland: 7 of 8 = 88%
Conclusion of First Accuracy Assessment • Small size and heterogeneity of wetlands make classification a challenge. • Sites with tree cover are difficult to classify using casi data alone. Lidar can identify drainage contours under tree canopy. • Some wetland sites not classifying as wetland, suggesting more spectra should be added to spectral library.
Wetland Drainage into Pond • Wetland vegetation in project area is typically isolated in small stands in drainage features. On the right, wetland vegetation is classified as red.